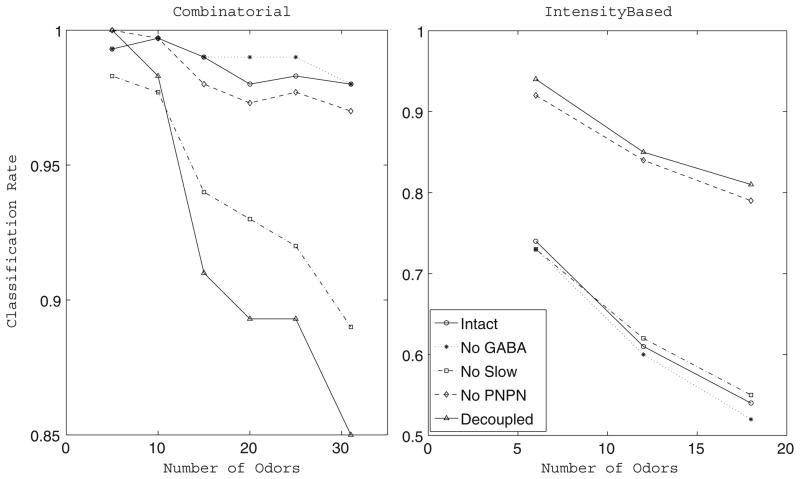
Fig. 5.
Combinatorial vs. intensity-based odor discrimination. Time-averaged fraction of trials correctly classified by the network versus number of odors the network was required to discriminate (20 trials per odor) in the case of the intact network, network with no GABA, network with no slow inhibition, network with no PN-PN connections, and completely decoupled network. In the combinatorial case (left figure), a total of 31 simulated odors were used, with different stimuli represented by different sets of PNs and LNs receiving stimulus current. In the intensity case (right figure), a total of 18 simulated odors were used, with different stimuli represented by a fixed set of PNs and LNs receiving different distributions of stimulus current intensity. In both cases, subsets of odors were chosen randomly from the entire set. Similar results were seen regardless of the subsets chosen

