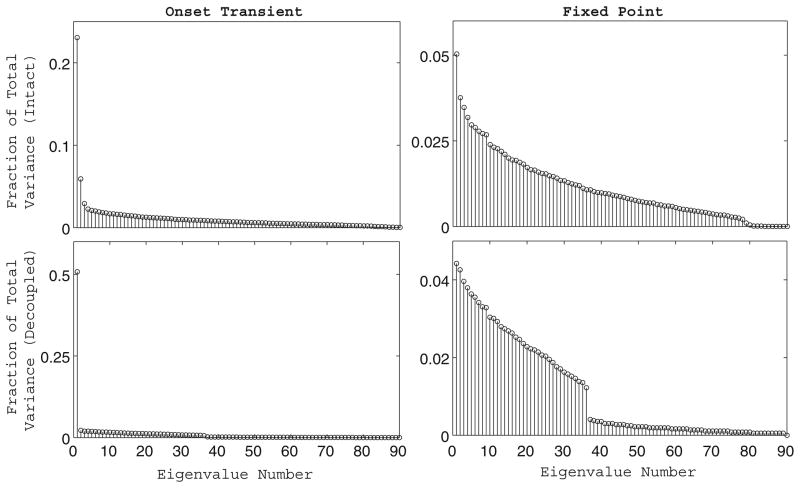
Fig. 7.
Dimensionality of the odor representation. Fraction of the total variance in the PN firing rate data captured by each principal component vector during an odor response. The fraction of data variance captured by a principal component was computed as the magnitude of the corresponding eigenvalue normalized by the sum of the magnitudes of all ninety principal component eigenvalues. We performed principal component analysis and computed the distribution of total data variance over the resulting principal components during the transient portion of the odor response (1–2 s, left column) and during the fixed point (2.5–3.5 s, right column) for both the intact network (top row) and the completely decoupled network (bottom row)

