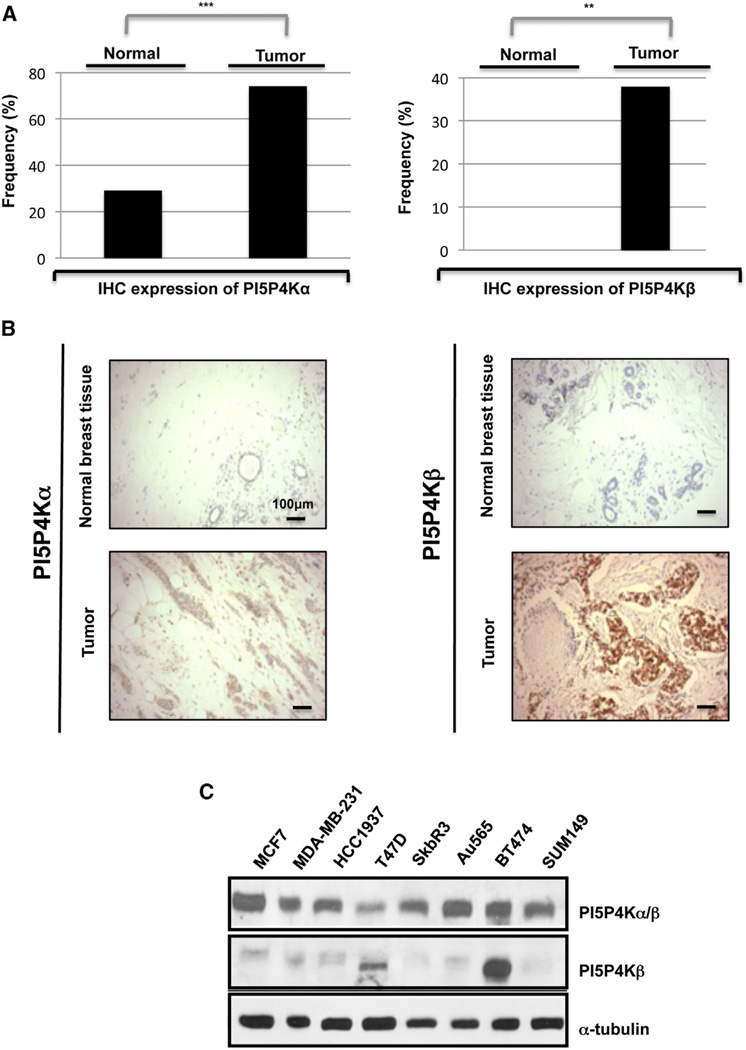
Figure 2. PI5P4K Expression in Breast Cancer.
(A) Histograms illustrating expression levels of PI5P4Kα (***p = 0.000) or PI5P4Kβ (**p = 0.004) in breast cancer samples.
(B) Representative IHC images from breast tumor and normal samples. Scale bar, 100 µm.
(C) PI5P4Kα and PI5P4Kβ expression in panel of breast cancer cell lines.

