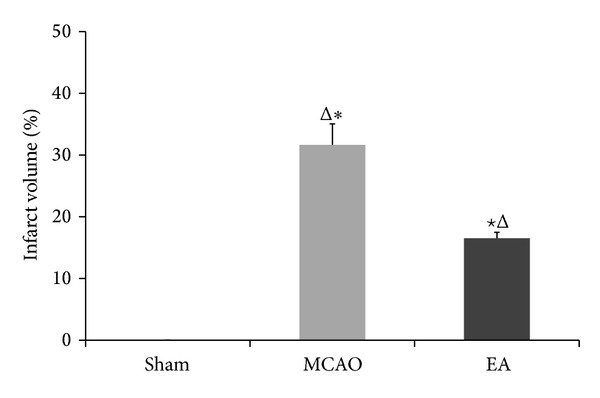
Figure 3.

Quantification from TTC staining of infarct volume in focal cerebral ischemia rats of 7 d after reperfusion. The ischemic infarct volume was quantified using image analysis software. The infarct volume of the sham group was 0. The infarction induced by MCAO was significantly reduced by EA at GV 20 and ST 36 acupoints. Data (n = 3) is represented as mean ± SD. ★ P < 0.05 versus the MCAO groups at the same time points. *P < 0.05 versus the EA groups at the same time points.
