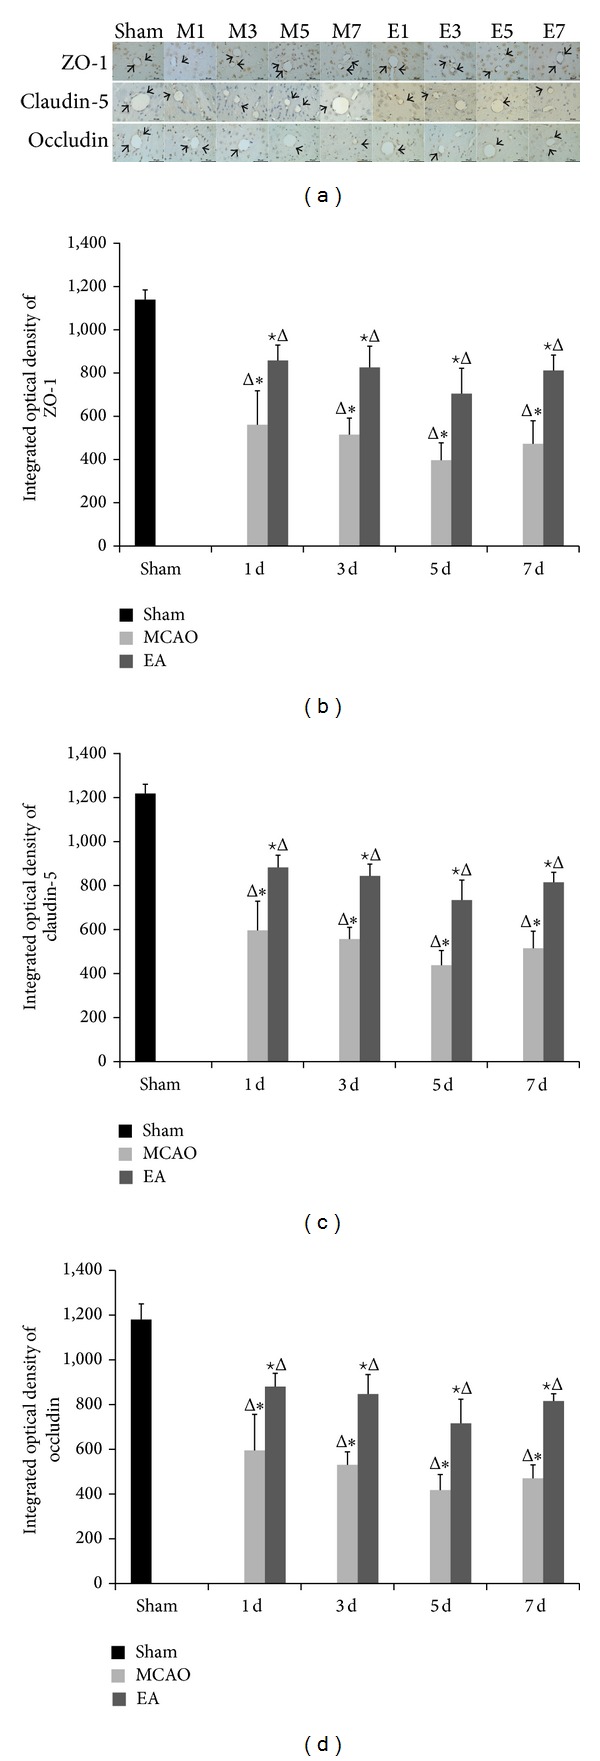
Figure 4.

Effects of EA on the distribution and expression of ZO-1, claudin-5, and occludin on ischemic cerebral microvessels. (a) Representative immunohistochemistry stained tissue of the following groups: sham; M1–M7: MCAO groups after 1, 3, 5, and 7 d of reperfusion; and E1–E7: EA groups after 1, 3, 5, and 7 d of reperfusion. The integrated optical density of ZO-1 (b), claudin-5 (c), and occluding (d). Data (n = 6) are represented as mean ± SD. Δ P < 0.05 versus the sham group, ★ P < 0.05 versus the MCAO group at the same time points, and *P < 0.05 versus the EA groups at the same time points. Arrows show the immunoreactive positive area. Scale bar in A = 50 μm (×400).
