
Figure 5.
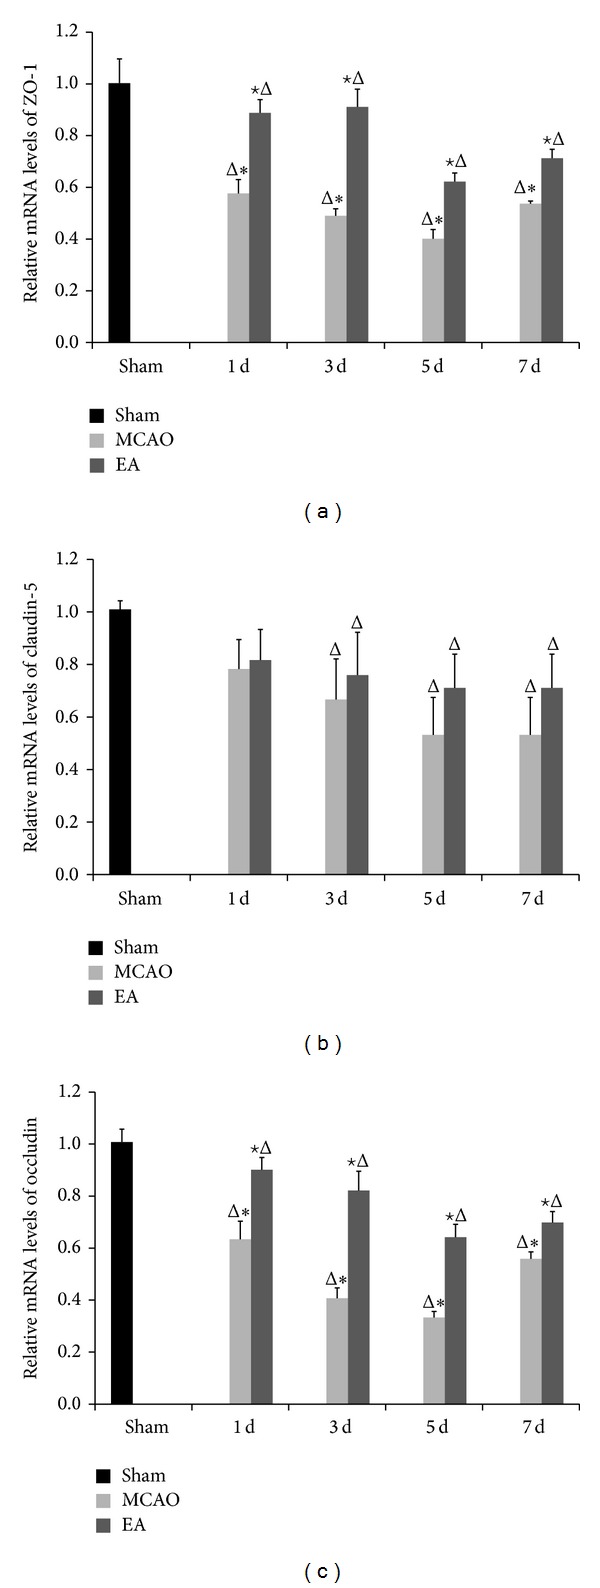
mRNA expression of ZO-1, claudin-5, and occludin analyzed by qPCR after EA. GAPDH served as endogenous reference. Experimental groups are sham; MCAO groups after 1, 3, 5, and 7 d of reperfusion; and EA groups after 1, 3, 5, and 7 d of reperfusion, respectively. The mRNA expression levels of ZO-1 (a), claudin-5 (b), and occluding (c) are shown. Data (n = 3) are represented as mean ± SD. Δ P < 0.05 versus the sham group, ★ P < 0.05 versus the MCAO group at the same time points, and *P < 0.05 versus the EA groups at the same time points.