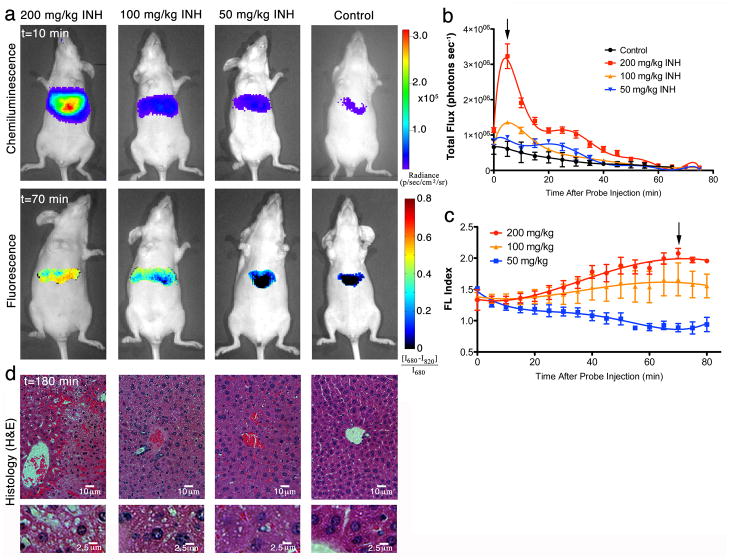
Figure 5.
Real-time in vivo imaging of dose-dependent hepatotoxicity in mice following INH administration. (a) Representative images of mice receiving, from left to right, 200, 100, 50 mg/kg INH, or saline i.p., followed by CF-SPN (0.8 mg i.v.). The emission intensities of the liver for the (b) chemiluminescence or (c) fluorescent ratiometric signals are shown over time. The black arrows indicate the respective time points shown in (a). Values are the mean±s.d. for n=3 mice. (d) Representative histology (H&E) of the liver of mice treated as in (a) is shown 180 min after drug administration, with corresponding image enlargements in the bottom row. Scale bars represent (top) 10 μm and (bottom enlargement) 2.5 μm, respectively.

