
Figure 3. Analysis of AhR activation in H16 clones.
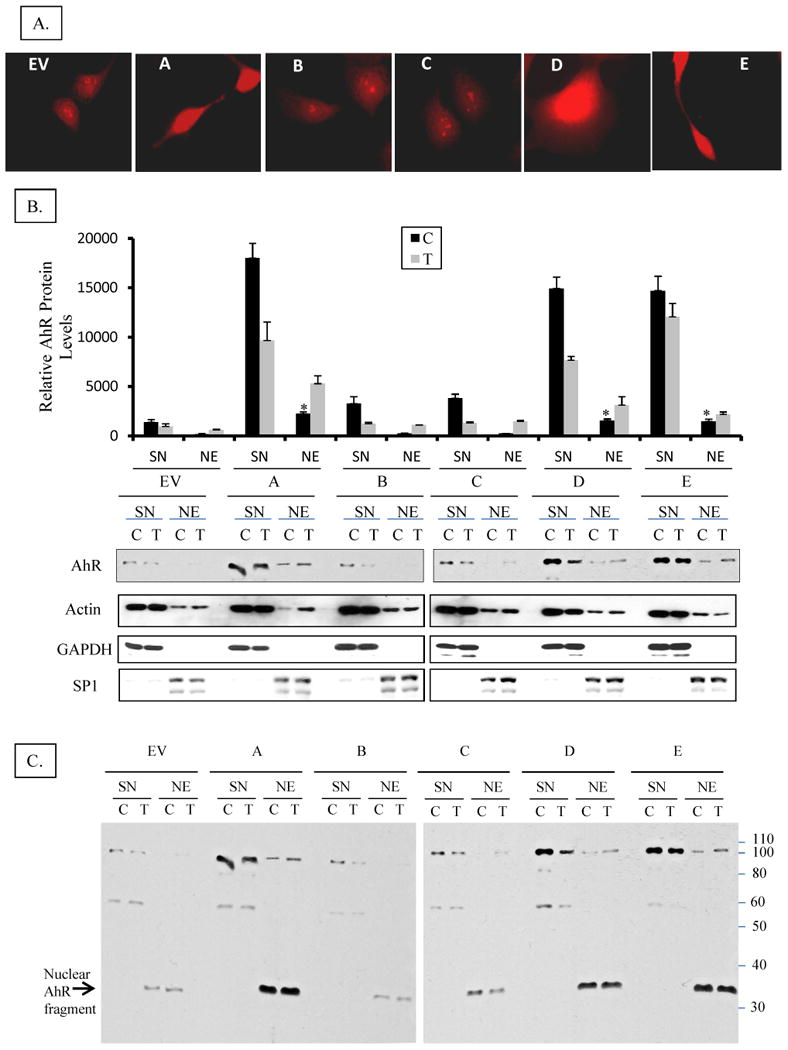
A. Subcellular localization of AhR in H16 clones by immuno-cytochemical staining Clones were grown on cover slips and fixed with methanol: acetone. AhR was visualized by staining with rabbit anti-AhR polyclonal antibodies followed by a rhodamine-conjugated donkey anti-rabbit. Images were captured on an Olympus wide field fluorescence microscope (1000x magnification).
B. Subcellular localization of AhR in H16 clones by nuclear and cytosolic fractionation Cell lines were grown on 6-cm dishes until ∼75% confluent then they were treated with 1 nM TCDD (T) or DMSO (C) for 3 hours. Cells were washed with cold PBS and lyzed at 4°C in 1% NP-40 lysis buffer containing a cocktail of protease and phosphatase inhibitors (as detailed in M & M), and fractionated into nuclei and supernatant (SN), which will be considered cytosolic fraction although it additionally contains detergent-solublized membranes. Nuclei were washed thoroughly in lysis buffer to remove cytosolic contamination then solublized by sonication in lysis buffer forming nuclear extract (NE). The nuclear extracts (NE) and cytosolic fractions (SN) were analyzed by Western blotting for AhR protein expression. The relative level of AhR was normalized by the respective actin level. Cell lysate of untreated EV cell was included as an internal control in different blots to correct for the inter-blot staining variations so as to allow for pooling values from different blots. In the upper panel bars represent means and standard deviations of the corrected values from three independent experiments and (*) denotes constitutive nuclear levels of AhR in clones that are significantly different from nuclear levels in untreated EV control. Lower panel is a representative blot stained consecutively for AhR, Actin (protein loading control), GAPDH (cytosolic protein marker), and Sp1 (nuclear protein marker).
C. Full Western immunoblot for AhR in the clones and EV control cell line A complete image of the representative Western blot shown in the lower panel of 3-B, above, demonstrating the full length AhR and its different fragments and their partitioning in cytosolic or nuclear fractions. Nuclear fragments at 37 kDa are denoted by an arrow.
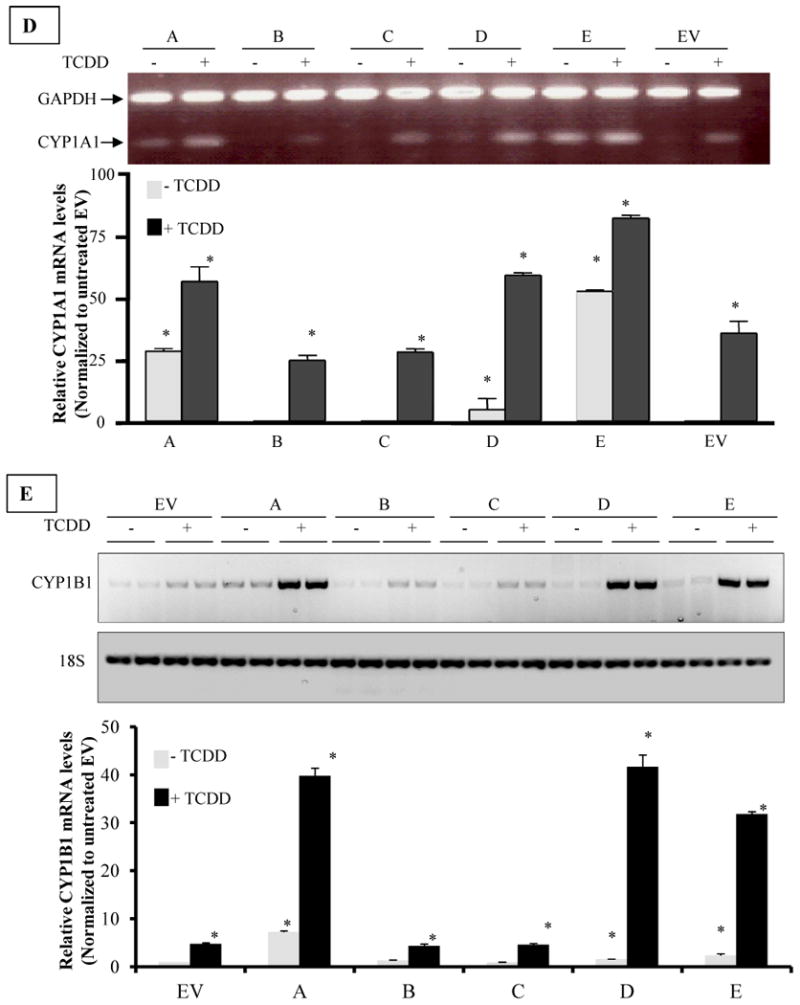
D. RT-PCR analysis of CYP1A1 mRNA expression in H16 Clones Cells were treated with I nM TCDD or vehicle (DMSO) for 24h and total RNA was isolated and subjected to reverse transcriptase (RT) reaction, as described in the M&M section. RT products were subsequently used for PCR amplification of CYP1A1 and glyceraldehyde-3-phosphate dehydrogenase (GAPDH) was amplified simultaneously as an internal control. Upper panel is a representative image of ethidium bromide-stained gel of PCR products from different clones. The intensity of bands was quantified by digital imaging and normalized to GAPDH signals. The means and standard deviations of duplicate PCR of three independent experiments were plotted in graph in lower panel. A (*) denotes significant difference from the values of untreated EV (p<0.05).
E. RT-PCR analysis of CYP1B1 mRNA expression in H16 Clones. Cells were treated TCDD or DMSO and RT-PCR analyses were performed essentially the same as for CYP1A1 except that 18s ribosomal RNA was used as an internal control. Upper panel is a representative image of inverse signal of ethidium bromide-stained gel of PCR products. The intensity of bands was quantified by digital imaging and normalized to 18s signals. The means and standard deviations of duplicate PCR of three independent experiments were plotted in graph in lower panel. A (*) denotes significant difference from the values of untreated EV (p<0.05).