
Figure 5. Analysis of cell cycle regulatory molecules in AhR-transformed H16N2 clones in comparison to their empty vector (EV) control.
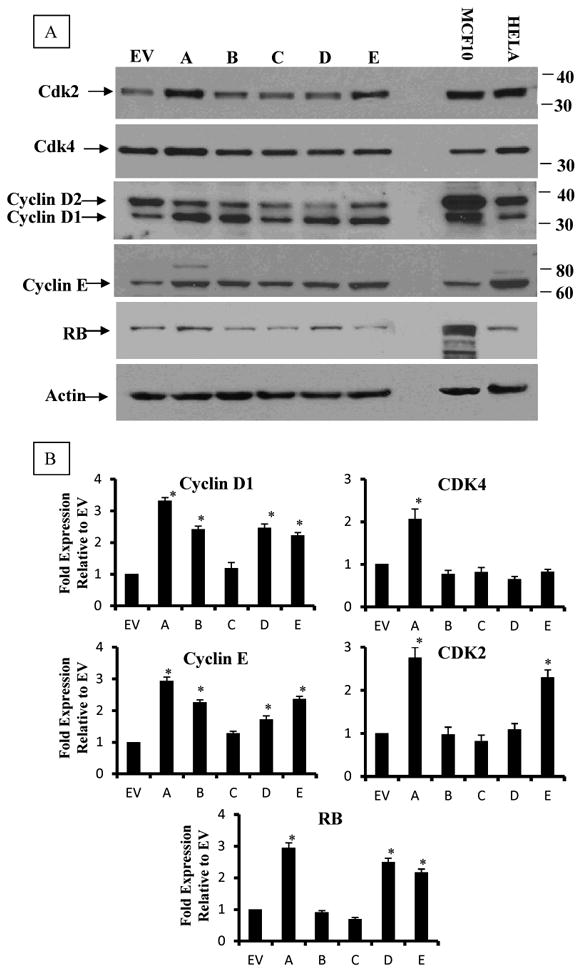
Expression of cyclins D1 and E, their cyclin-dependent kinases CDK2 and CDK4 and tumor suppressor RB. Cells growing at 80% confluent were lyzed in Trizol and proteins were isolated and analyzed by Western blotting. Upper Panel is a representative blot and lower panel is the densitometric quantitation of the blots. Values in the graphs are means and standard deviations of n=3 independent blot analyses of duplicate experiment, extracts from MCF10 and Hela cell line were used as internal standard. Significant increase over the values of EV (p<0.05) is denoted by (*).