
Fig. 2.
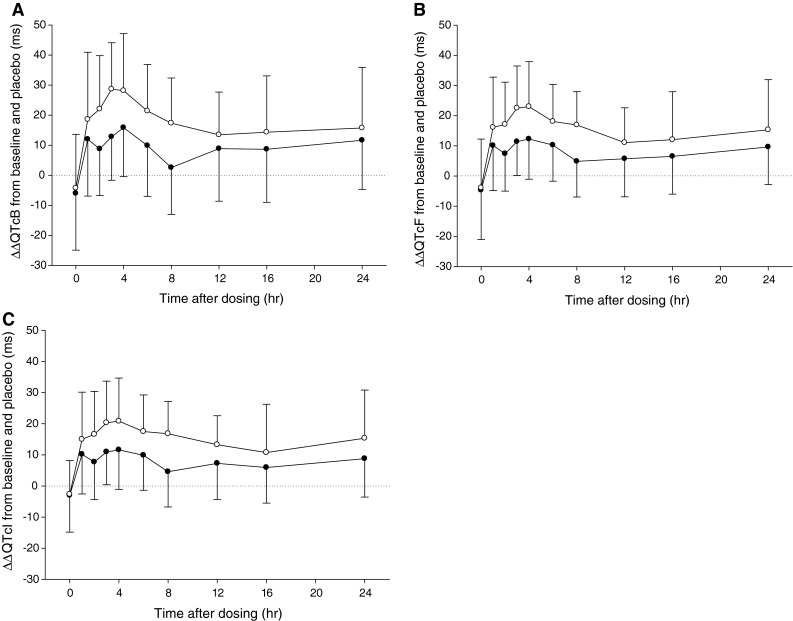
Baseline- and placebo-corrected QT (ΔΔQTc)-time profiles using: a Bazett’s formula, b Fridericia’s formula, and c the individually corrected method. The data are presented as the arithmetic means ± standard deviation (solid circle 400 mg, open circle 800 mg)