
Fig. 3.
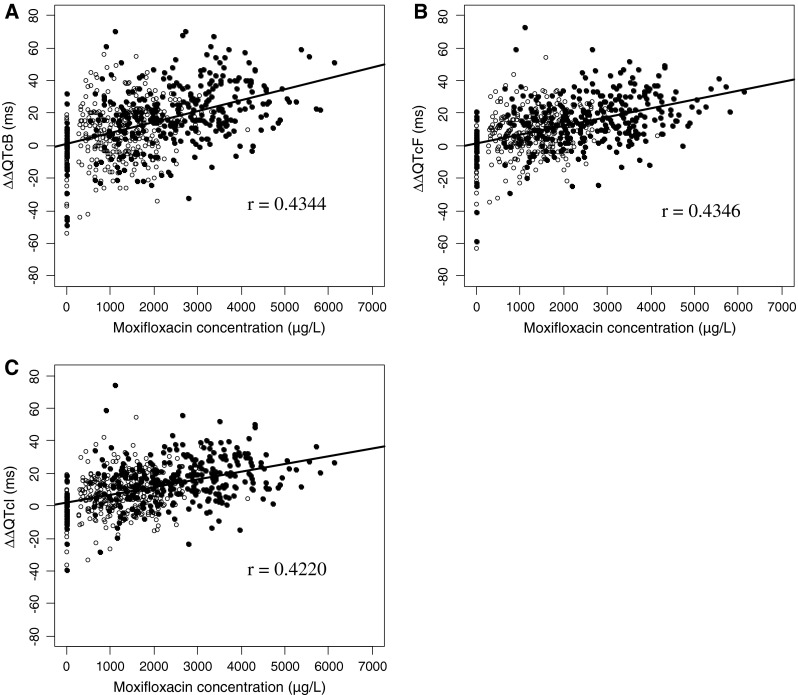
Plasma concentrations of moxifloxacin vs. corrected QT (ΔΔQTc) scatter plot and regression lines using: a Bazett’s formula, b Fridericia’s formula, and c the individual correction method. The equations for each regression line were as follows: a ΔΔQTcB = 0.901 + 0.00670 × moxifloxacin concentration, b ΔΔQTcF = 1.39 + 0.00535 × moxifloxacin concentration, and c ΔΔQTcI = 2.36 + 0.00470 × moxifloxacin concentration (open circle 400 mg, solid circle 800 mg)