
Figure 4.
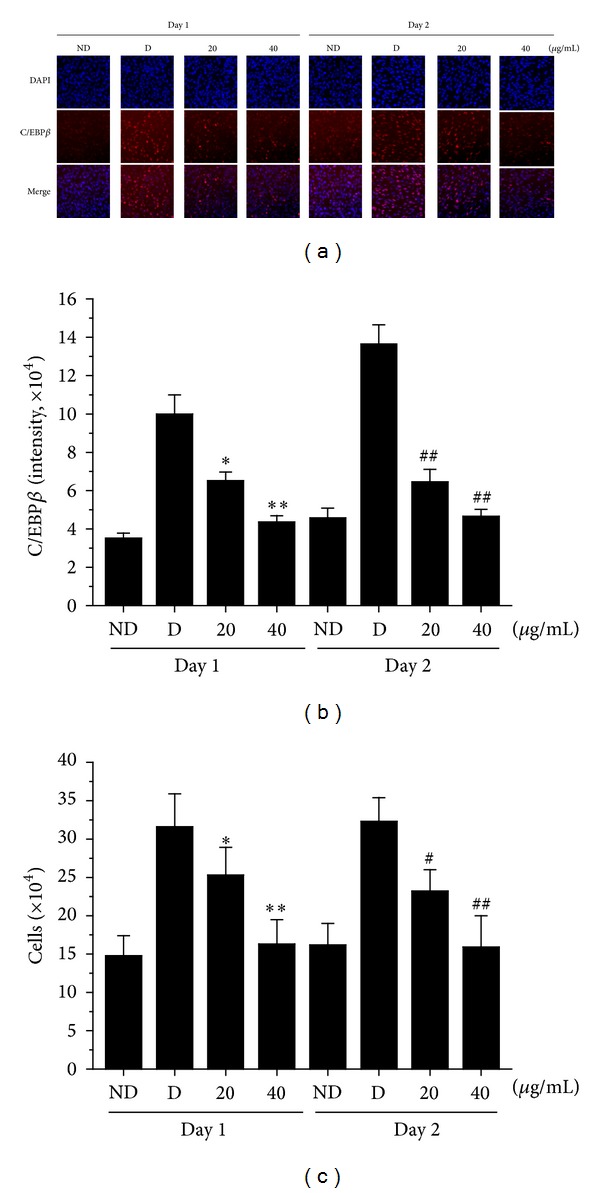
Effects of AOE on C/EBPβ expression and cell proliferation in OP9 cells. (a) OP9 cells were pretreated with 20 or 40 μg/mL AOE for 1 h and then cultured with adipogenic inducers. After 1 day and 2 days of differentiation, immunohistochemical staining of OP9 cells was carried out using a specific antibody to visualize C/EBPβ (red) and DAPI to visualize nuclei (blue). (b) C/EBPβ expression levels were determined by averaging the nuclear antibody staining intensity from 5,000 individual cells. (c) The number of cells treated with 20 and 40 μg/mL AOE was determined using a hemocytometer. Experiments were carried out in triplicate and data are expressed as the mean ± SD values of at least 3 independent experiments. ∗, # P < 0.05; ∗∗, ## P < 0.01 compared to the D group at days 1 and 2, respectively. ND: no differentiation, D: differentiation.