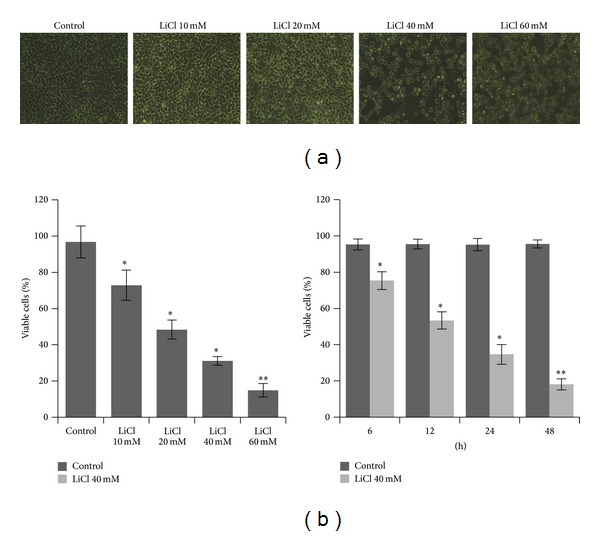
Figure 1.

(a) Morphological changes of SW480 cells exposed to different concentrations of LiCl (10 mM, 20 mM, 40 mM, and 60 mM). (b) The percentage of viable SW480 cells. Cells were treated with different concentrations of LiCl (10 mM, 20 mM, 40 mM, and 60 mM) or treated with LiCl for 6, 12, 24, or 48 hours, respectively. Each point is mean ± SEM for at least three individual experiments. Original magnification, ×100.*P < 0.05 and **P < 0.01 versus Control group.
