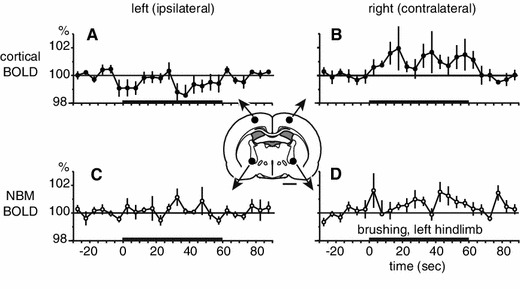
Fig. 2.

Changes in BOLD signals in the parietal cortex and the NBM induced by brushing of the left hindlimb. BOLD signals during the 2-min trial measured every 5 s in the parietal cortex (a, b) and the NBM (c, d), ipsilateral (a, c) and contralateral (b, d) to the stimulated hindlimb, expressed as a percentage of prestimulus control signal (n = 5). Averages of 30 s before the brushing are used as prestimulus control signal. The thick horizontal lines on the abscissa indicate the 1-min period of stimulation. BOLD signal was extracted from each ROI illustrated by black circles in the inset of a coronal slice at 1.4 mm posterior to bregma. Scale bar below inset 2 mm
