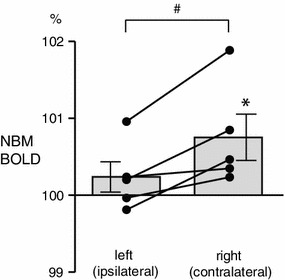
Fig. 3.

Changes in BOLD signals in the NBM during brushing of the left hindlimb. Mean values of BOLD during brushing are plotted as the percentage of prestimulus control value (averages of 30 s before stimulation). Each column and error bar shows the mean ± SE (n = 5). Each point indicates individual data. Each data obtained simultaneously is connected by a line. *p < 0.05; significantly different compared to the prestimulus control value (statistical analysis was performed using absolute values). # p < 0.05; significantly different between values
