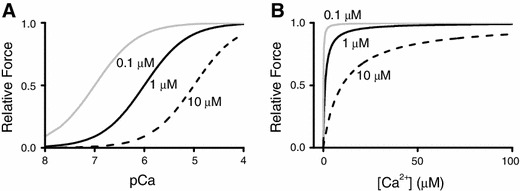
Fig. 4.

Active force plotted against pCa or [Ca2+]i. a Active force–pCa curves simulated based on the equation (i.e., ), where F, pCa50 and h indicate relative force, the mid-point of each curve and the Hill coefficient, respectively (x pCa; y relative force). Three different apparent pK d values for Ca2+-binding to TnC (calculated using hypothetical SL changes) were used for simulation, i.e., 0.1, 1 ,and 10 μM, at h = 1. b Active force–[Ca2+] curves simulated based on the equation (i.e., ), where EC50 indicates the mid-point of each curve (x [Ca2+]; y relative force). Three different apparent K d values for Ca2+-binding to TnC (calculated using hypothetical SL changes) were used for simulation, i.e., 0.1, 1, and 10 μM, at h = 1. As shown in the graphs, Ca2+ sensitivity is more clearly indicated in (a) using pCa values (see text for details)
