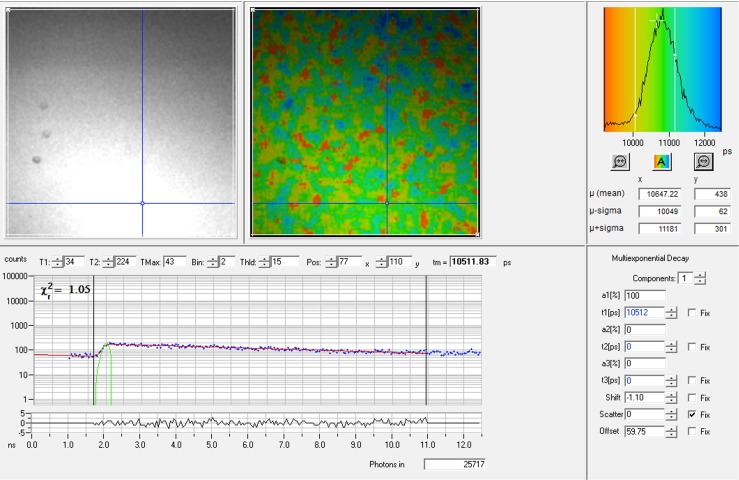
Fig. 3.

The upper part of the Figure shows (from left) the intensity image, the color-coded lifetime image and the lifetime histogram of a 10−3 M lucifer yellow concentration in ethanol. The mean lifetime of this particular measurement was 10647 ps. The lower part of the Figure shows the fluorescence decay curve from a single pixel in the lifetime image as indicated by the blue crosshair. The green curve at the start of the decay curve is the instrument response function. The χ 2-value was close to 1, meaning that the curve was a good fit for a single lifetime component, as was selected in the right lower part of the Figure. Since the lifetime of lucifer yellow is close to the time between the laser pulses (12.5 ns), it was necessary to select the feature incomplete multiexponentials in the software program to compensate. The lifetime calculated from this particular decay curve was 10512 ps, and 25717 photons were counted for this pixel in total
