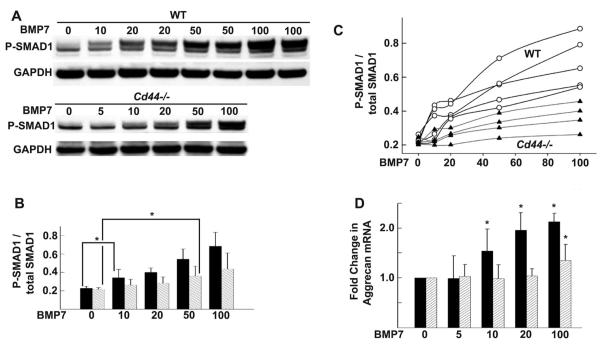
Figure 2.
Responsiveness of chondrocytes from wild-type (WT) mice and CD44−/− mice to bone morphogenetic protein 7 (BMP-7). Chondrocytes were stimulated with 0–100 ng/ml of BMP-7. A, Representative Western blots of Smad1 phosphorylation (p-Smad1). GAPDH was used as a loading control for protein content. Smad1/5/8 is activated at lower concentrations of BMP-7 in chondrocytes from WT mice (solid bars) than in those from CD44−/− mice (hatched bars). B, Ratio of p-Smad1 to total Smad1, as indicated by the pixel intensities of the quantified protein bands for each BMP-7 concentration. Values are the mean ± SD of 5 separate experiments. * = P < 0.05. C, Ratio p-Smad1 to total Smad1 in chondrocytes from individual WT mice (open circles) and CD44−/− mice (solid triangles), as indicated by pixel intensities of quantified protein bands for each BMP-7 concentration. D, Fold change in aggrecan mRNA copy number following stimulation of chondrocytes from WT mice (solid bars) and CD44−/− mice (hatched bars) with 0–100 ng/ml of BMP-7, as determined by real-time reverse transcription–polymerase chain reaction analysis. Results represent duplicate cultures at each BMP-7 dose, each analyzed in duplicate. Values are the mean ± SD of 4 independent experiments (cell harvests). * = P < 0.05 versus control.

