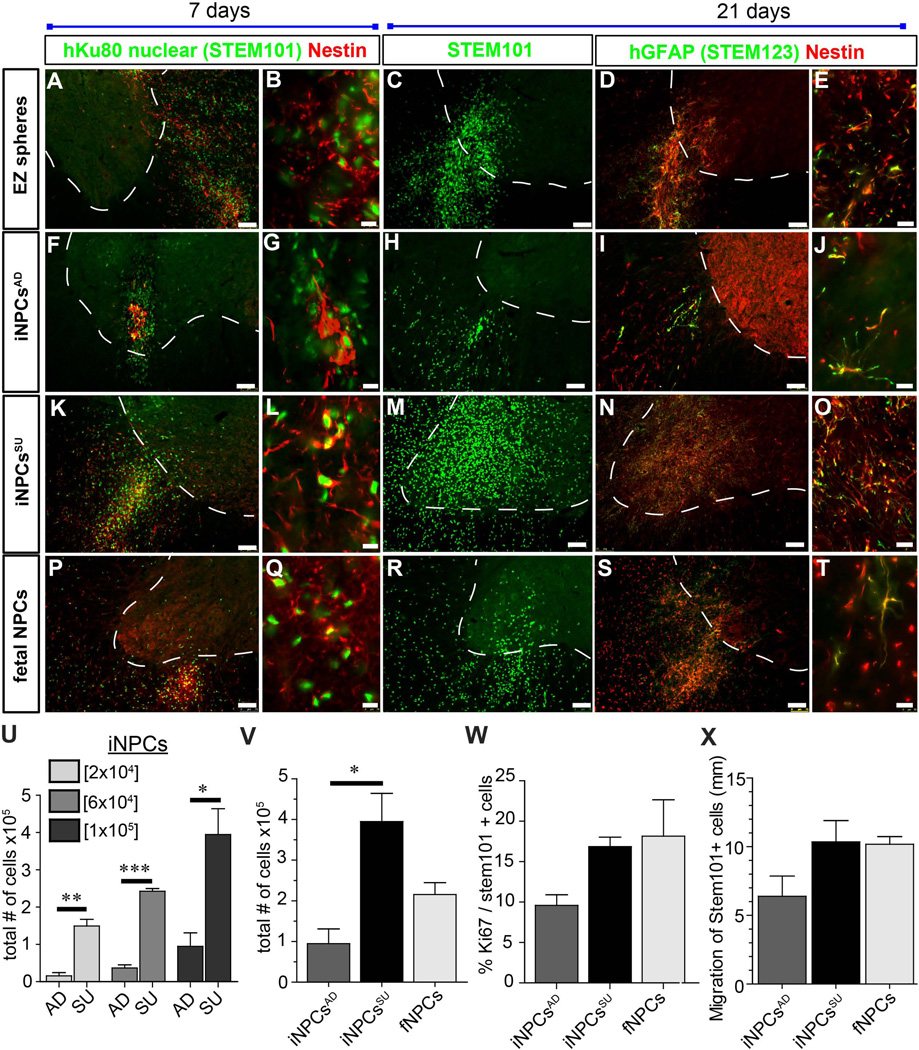
Figure 7. Engraftment of neural stem and progenitor cells in the rodent spinal cord.
(A–E) EZ spheres, (F–J) iNPCsAD, (K–O) iNPCsSU, and (P–T) fNPCs were transplanted into the spinal cord of athymic nude rats. Transplanted cells from each cell type survived to varying degrees and were observed at 7 and 21 days post-transplantation by STEM101, nestin and GFAP immunofluorescence staining in histological sections. Representative images with similar results are shown from n=3–4 animals that were transplanted in each group. (U) Graph showing cell concentration dosage (2×10⁴, 6×10⁴ and 1×10⁵) and cell survival of transplanted iNPCsSU vs. iNPCsAD as determined by stereological counting of STEM101+ cells and 1/12th section sampling in 7 day post-transplantation spinal cords. Much greater cell survival was noted at all cell dosages in iNPCsSU. *** = p<0.001, ** = p<0.01; * = p<0.05; unpaired t-test (two-tailed). (V) Greater cell survival (STEM101+) was also observed in iNPCsSU vs. iNPCsAD at 21 day post-transplantation. However, no significant difference in survival was observed between fNPCs vs. iNPCsSU or iNPCsAD by stereological counting and 1/12th section sampling.* = p<0.05; one-way ANOVA (Bonferroni post-test). (U, V) STEM101 counts: Coefficient of error (CE) range was 0.03–0.08 and markers counted were 193–2956. One sample in the 2×10⁴ iNPCsAD group had CE of 0.28 and 13 markers counted. (W) Proliferation of grafted cells (Ki67) was analyzed on tissue from animals having received cells at a concentration of 60,000 cells/µl. No significant differences were observed in cell proliferation by Ki67. CE ranges were 0.1–0.22 (Ki67) and 0.08–0.17 (STEM101). Markers counted 22–83 (Ki67) and 193–585 (STEM101). As expected, in all stereological counts in these data sets, the lowest CE and number of markers counted were observed in the iNPCsAD samples associated with the very small grafts. (X) No significant differences were observed in cell migration between iNPCsAD, iNPCsSU, and fNPCs; one-way ANOVA. *** = p<0.001, ** = p<0.01; * = p<0.05; unpaired t-test (two-tailed). Scale bars: A, C, D, F, H, I, K, M, N, P, R, S = 75 µm and B, E, G, J, L, O, Q, T = 10 µm. (U–X) n=3–4 rats per group were transplanted and analyzed.

