
Figure 2.
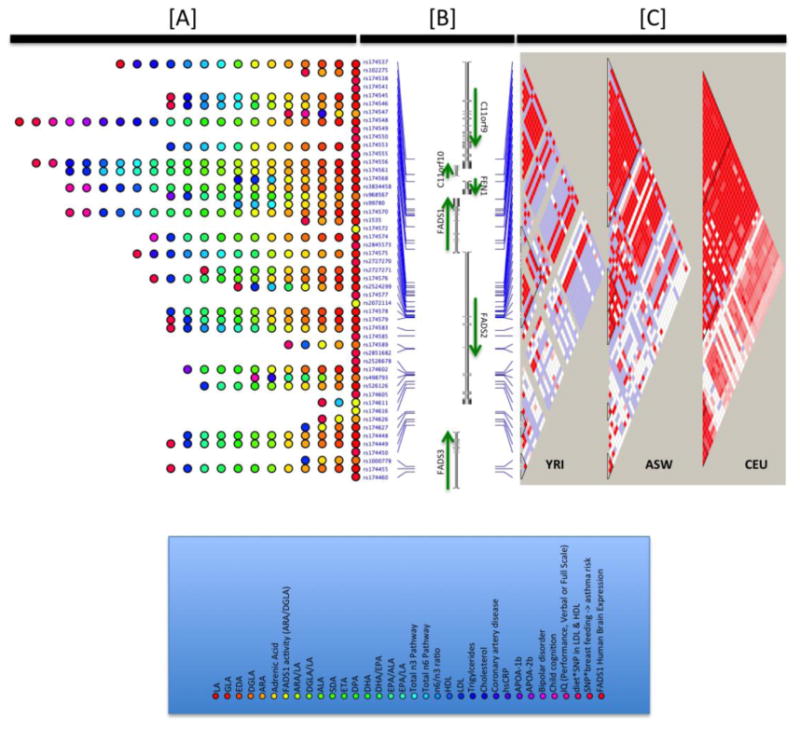
Illustration of the associations observed between genetic variants within and near the FADS locus and phenotypes/traits of relevance. Panel A shows the orientation of genes in this regions and the SNPs implicated across the range of studies ([20-43, 56-60, 86-93]), phenotypes presented are those with p<0.05 in at least one reviewed study. Panel B illustrates the strength of linkage disequilibrium in three populations from the Thousand Genomes Project [94], including the European ancestry CEU samples, African YRI samples and the African American ASW samples. The strength of LD between variants in this region reveals an extensive block of high LD (red regions) in the European ancestry samples and smaller blocks in the African ancestry samples. Panel C indicates the range of phenotypes with p<0.05 at each SNP under consideration.