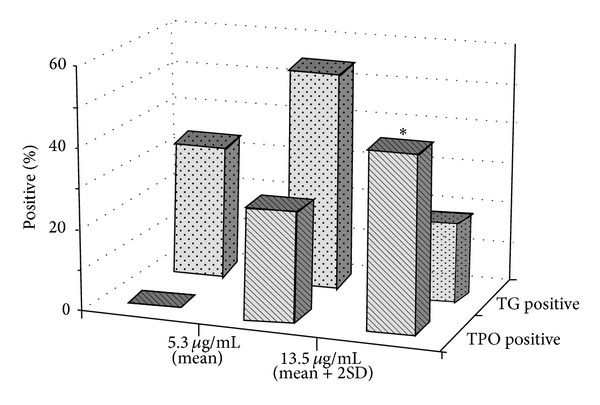
Figure 3.

Prevalence of samples positive to anti-TG and anti-TPO antibodies in patients with different anti-Neu5Gc antibody concentrations. *odd ratio = 0, Fisher's exact P = 0.0002 when compared with the group with anti-Neu5Gc < 5.3 μg/mL. 5.3 μg/mL = mean anti-Neu5Gc concentration in general population, and 13.5 μg/mL = mean + 2 SD anti-Neu5Gc concentration of general population.
