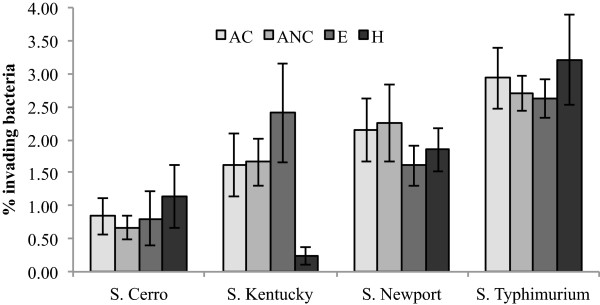
Figure 3.

Caco-2 invasion efficiencies among Salmonella serovars Cerro, Kentucky, Newport, and Typhimurium. Cells were inoculated at a MOI of 10 and the invasion assays were performed at 37°C and 5% CO2. Invasion efficiency was calculated as [CFU recovered/CFU infected] × 100. Data represent the mean of at least three biological replicates, and the error bars represent the standard deviation. The invasion efficiencies for each serovar were analyzed using one-way analysis of variance (ANOVA) and Tukey’s post hoc test, after the data was log-transformed to satisfy ANOVA assumptions of normality. Isolate sources are abbreviated as AC, Animal Clinical; ANC, Animal Non-clinical; E, Environmental; H, Human.
