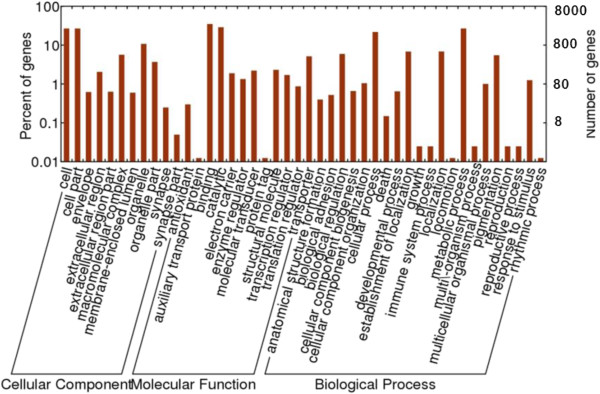
Figure 4.

Histogram of Anopheles sinensis expressed sequence tag (EST) Gene Ontology (GO) classification. Three main ontologies of GO (biological process, cellular component and molecular function) are shown in the x-axis. The left y-axis indicates the percentage of total genes and the right y-axis is the number of genes in each category.
