
Figure 6.
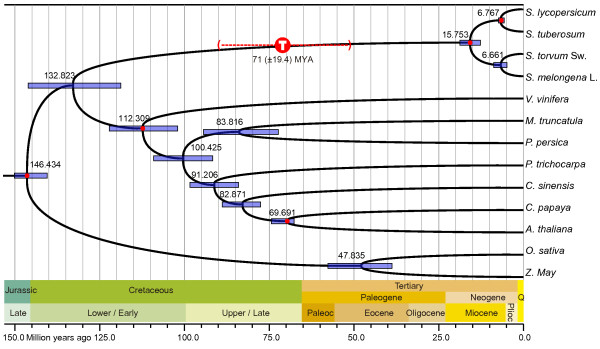
Estimation of divergence time using the three codon position–specific datasets. The purple bars at the nodes indicate 95% posterior probability intervals. The geological time scale is in millions of years. The red dots correspond to the calibration time points listed in the Materials and Methods. Confirmed whole-genome triplication shared by Solanum and estimated at 71 (±19.4) MYA [2] is shown with annotated circles (‘T’), with dashed line indicating confidence interval. Paleoc, Paleocene; Plioc, Pliocene; Q, Quaternary.