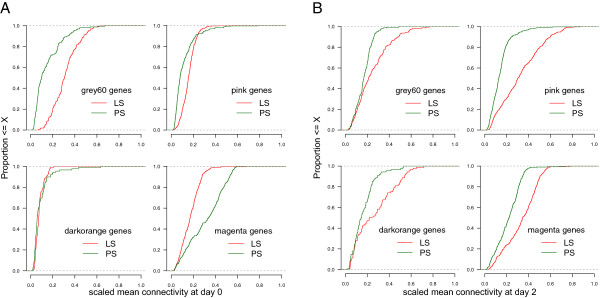
Figure 5.

Differential connectivity of genes within Salmonella shedding associated modules. Connectivity measures of genes within Salmonella shedding associated modules in low and persistent shedders at day 0 (A), and at day 2 (B). The connectivity measures were normalised to the maximum connectivity within each network. The x-axis refers to the scaled mean connectivities of genes within a particular module in the LS and PS samples. The y-axis refers to the proportion of those genes whose scaled mean connectivities falls below a particular connectivity level.
