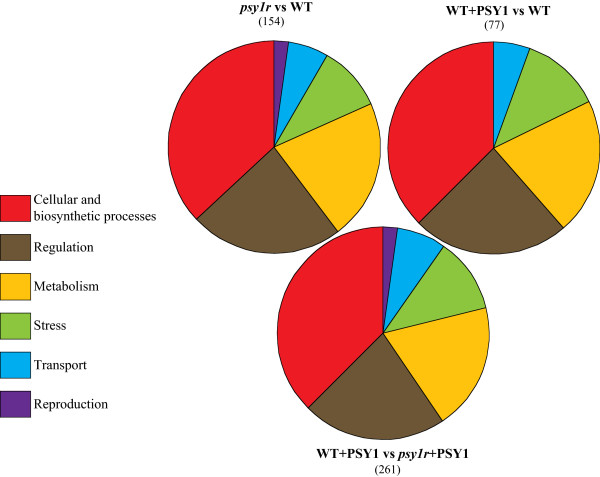
Figure 2.

Gene Ontology ( GO ) terms depicting the distribution of expressed genes by Amigo GO ( http://amigo.geneontology.org/cgi-bin/amigo/go.cgi ). Venn diagram represents the percentage of each biological function obtained by genes involved in corresponding functions divided by all expressed genes. The category psy1r vs WT that represents the percentage of differentially expressed genes attributed to specific biological functions in psy1r mutant plants compared to wild type (psy1r vs WT). The category “WT + PSY1 vs WT” represents the percentage of differentially expressed genes after PSY1 treatment compared to untreated wild type. Other category “WT + PSY1 vs psy1r + PSY1” highlights the percentage of differentially expressed genes in PSY1-treated receptor mutant plants compared to PSY1-treated wild type plants.
