
Figure 2. Constructive effect of independent noise on the coupling of the phase ensemble with STDP.
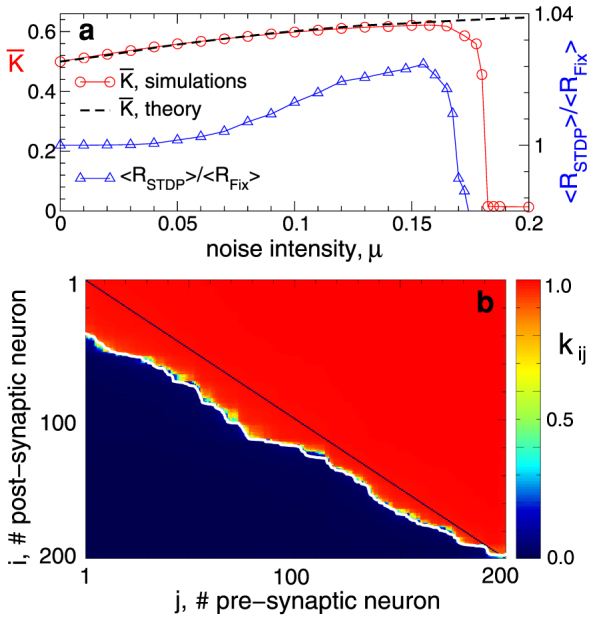
(a), Mean coupling weight  and ratio 〈RSTDP〉/〈RFix〉 (scale on the right vertical axis) between the time-averaged order parameters for the ensemble with and without STDP, respectively, versus noise strength μ. In the latter case the coupling matrix is fixed KFix (see Methods). (b), Coupling matrix KSTDP established in the phase ensemble due to STDP for the noise intensity μ = 0.1. The dashed black curve in (a) approximates the mean coupling weight
  , and the white curve in (b) bounds the region of potentiated coupling weights, both as predicted by the theory (see text for details). The oscillators are sorted with respect to increasing natural frequencies ωi which are uniformly and randomly distributed in the interval [0.9, 1.1].