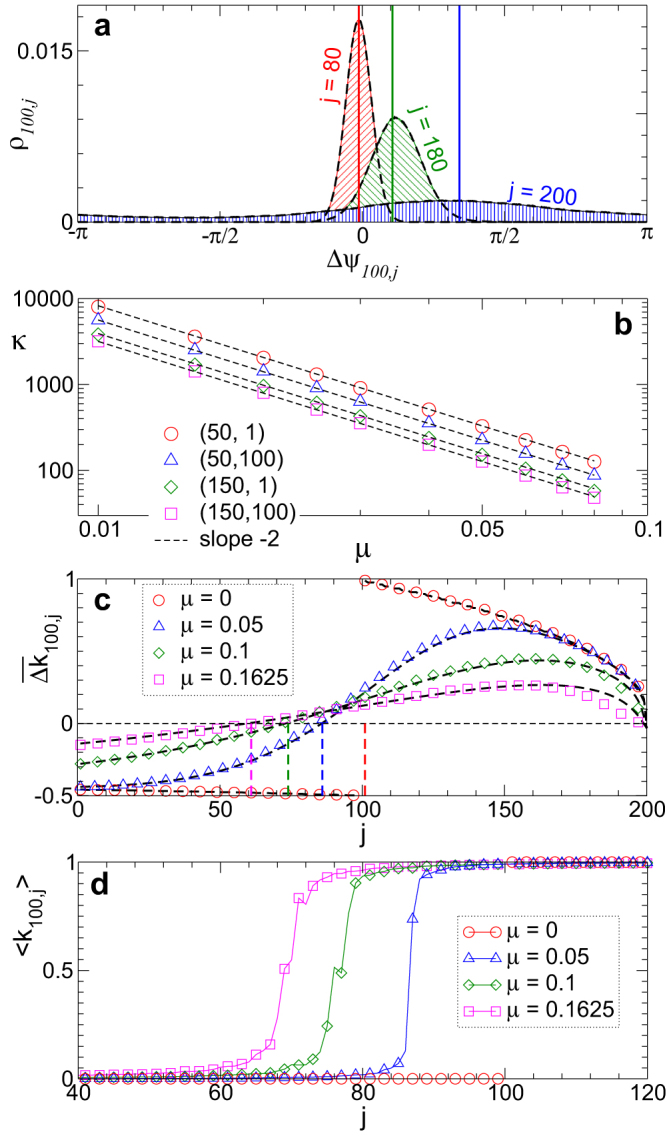
Figure 3. Impact of the noise-induced dynamics of the phase differences on coupling weights of the phase ensemble.

(a), Noise-induced distribution densities ρij of the phase differences Δψij(μ) between the post-synaptic oscillator i = 100 and pre-synaptic oscillators j indicated in the plot. The hatched histograms illustrate the results of numerical simulations for noise intensity μ = 0.1, the enveloping dashed black curves depict the von Mises distribution (3) for fitted κ, and the vertical lines are delta-peak distributions for the noise-free case according to equation (2). (b), Log-log plot of parameter κ(Δψij) of the fitted von Mises distribution (3) versus μ for oscillator pairs (i, j) indicated in the plot. The dashed black lines have the slope −2. (c), The average update rate  of the coupling weights. The black dashed curves depict the theoretical approximation calculated according to equations (1)–(4) with γ = −2 and β = −9.52, while the symbols represent the results of numerical simulations. Vertical dashed lines indicate the index j where the predicted
  crosses zero. In plots (a)–(c) coupling matrix is fixed to KFix (see Methods). (d), Time-averaged coupling weights 〈k100,j〉 established in the phase ensemble with STDP for noise intensities as in plot (c). Natural frequencies ωi = 0.9 + 0.2(i − 1)/(N − 1), i = 1, 2, …, N, N = 200.
