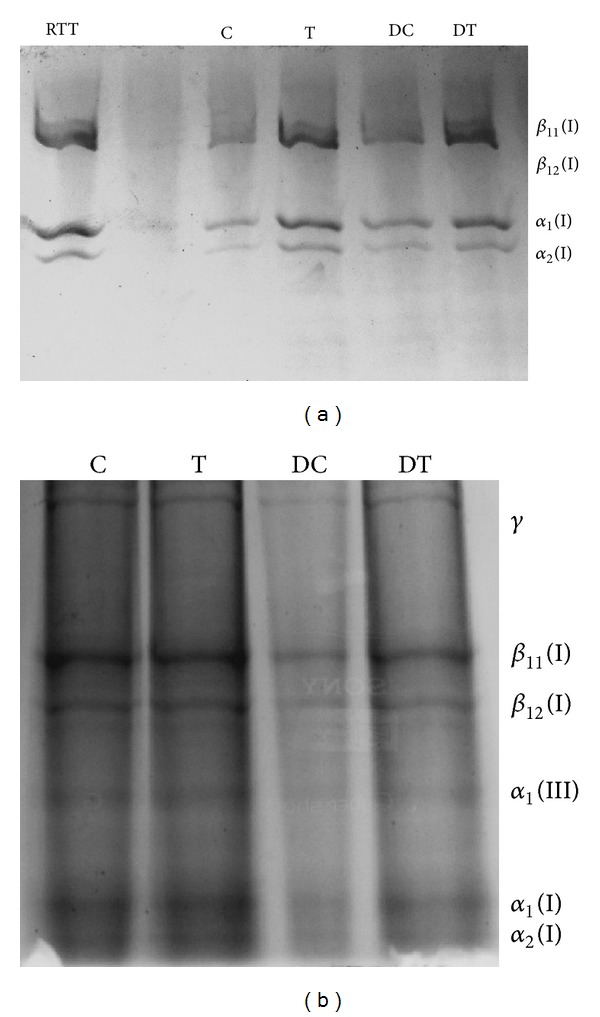
Figure 4.

Normal (a) and interrupted (b) SDS-PAGE photograph showing the distribution of collagen. All lanes were loaded with equal concentration of collagen (25 μg). RTT: rat tail tendon; C: control; T: treated; DC: diabetic control; DT: diabetic treated.
