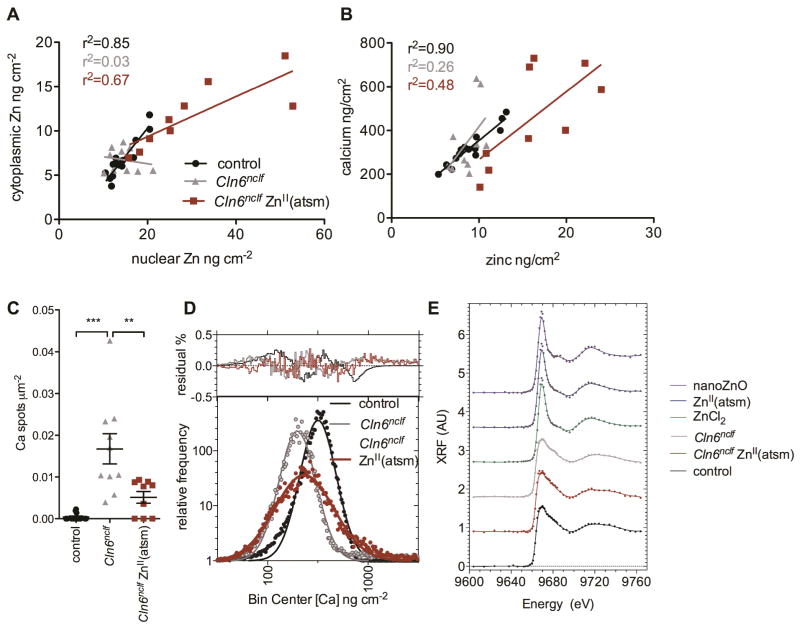
Fig 5. ZnII(atsm) treatment restores subcellular biometal homeostasis in CbCln6nclf cells.
A. The nuclear concentration of zinc in each individual cerebellar control cell (black circles), CbCln6nclf cell (grey triangles) and CbCln6nclf cell treated for 2h with 1μM ZnII(atsm) (red squares) was plotted against the cytoplasmic concentration of zinc in the same cell. Linear regression analysis was performed in GraphPad Prism. r2 values for the strength of each correlation are presented. B. The concentration of zinc in each individual control cell (black circles), CbCln6nclf cell (grey triangles) and CbCln6nclf cell treated for 2h with 1μM ZnII(atsm) (red squares) was plotted against the concentration of calcium in the same cell. C. Binary masks were generated to examine the number of regions of high calcium intensity (above 2μg cm−2) per cell area for each treatment group. ** p<0.01, *** p<0.0001 by one-way ANOVA and Bonferroni multiple comparison posttests. Error bars represent SEM. D. The histograms (tabulated frequency, bin width=0.0385 ng cm−2) of the log-transformed calcium concentrations in cells were modeled by Gaussian curves (solid black, grey or red lines). The residual plots are presented above the histograms. E. Zinc K-edge XANES of control cell, CbCln6nclf cells and CbCln6nclf cells treated for 2h with 1μM ZnII(atsm) was performed using X-rays at 58 energies ranging from 9.604 to 9.76 keV. Pre-edge absorbance values were linearized and normalized XANES is expressed as a percentage of the absorbance maxima. XANES spectra for ZnCl2 and ZnO nanoparticles are presented as controls.

