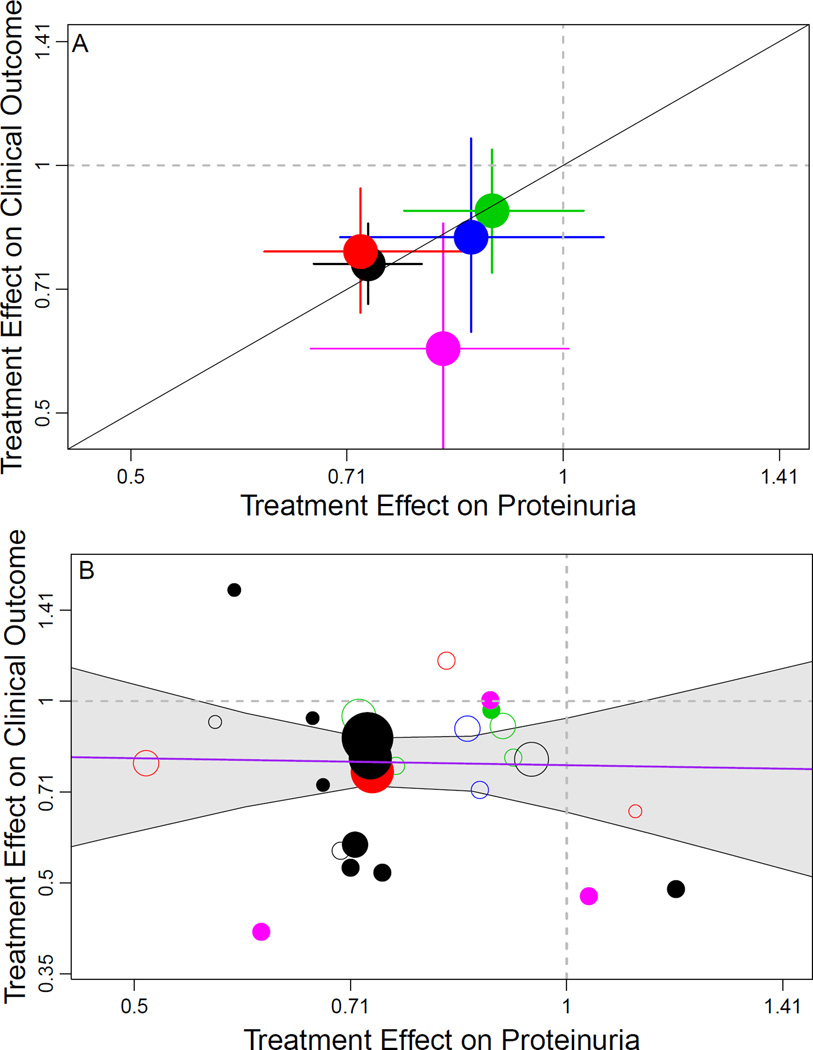
Figure 4. Trial-level Assessment of Validity of Proteinuria as a Surrogate Endpoint.
Shown is the relationship between estimated treatment effects on the clinical outcome (time to doubling of serum creatinine, ESRD, or death) on the vertical axis to estimated treatment effects on the early change in proteinuria (on the horizontal axis). Treatment effects on the clinical outcome are expressed as hazard ratios and treatment effects on early change in proteinuria are expressed as geometric mean ratios. Proteinuria was log transformed in each analysis. The colors indicate intervention type. Black, renin-angiotensin system blockade vs. placebo; red, renin-angiotensin system blockade vs. calcium channel blocker, green, intensive blood pressure; magenta, immunosuppressive therapies. Top panel: Aggregate results for the 5 interventions. The diagonal line is the line of identity. Solid lines extending from circle indicate the Bayesian credible intervals for the treatment effect on the clinical endpoint and change in urine protein. Bottom panel: Results for individual studies. The diameters of the circles are approximately proportional to the square root of numbers of events for the clinical outcome in each trial. The bolded circles indicate studies with median baseline proteinuria > 1 gram/day. The 95% Bayesian credible interval for the regression coefficient relating the treatment effects was too wide to be informative, ranging from a 0·60% lower to a 0·64% higher HR for the clinical endpoint for every 1% lower geometric mean ratio for proteinuria.

