Figure 1.

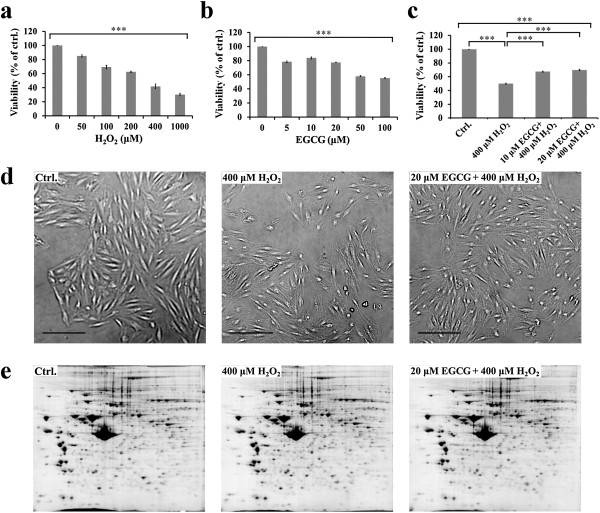
A proteomic study of the effects of EGCG on H2O2-induced oxidative stress in H9c2 cells. (a) MTT assay of cell viability after incubation with 0, 50, 100, 200, 400 and 1000 μM H2O2 for 30 min (b) MTT assay of cell viability after incubation with 0, 5, 10, 20, 50 and 100 μM EGCG for 30 min (c) H9c2 cells were pre-treated with 10 and 20 μM EGCG for 30 min followed by 400 μM H2O2 for 30 min, cell viability was measured by MTT assay (d) Phase contrast microscopy showing cell morphology of H9c2 cells in the condition of control (left), 400 μM H2O2 exposure for 30 min (middle), and 20 μM EGCG pre-treatment for 30 min followed by 400 μM H2O2 exposure for 30 min (right). (Scale Bar = 200 μm). (e) 2-DE gel images showing protein distribution in the condition of control (left), 400 μM H2O2 exposure for 30 min (middle), and 20 μM EGCG pre-treatment for 30 min followed by 400 μM H2O2 exposure for 30 min (right). In a, the values are the mean ± SEM, with ***p < 0.001.
