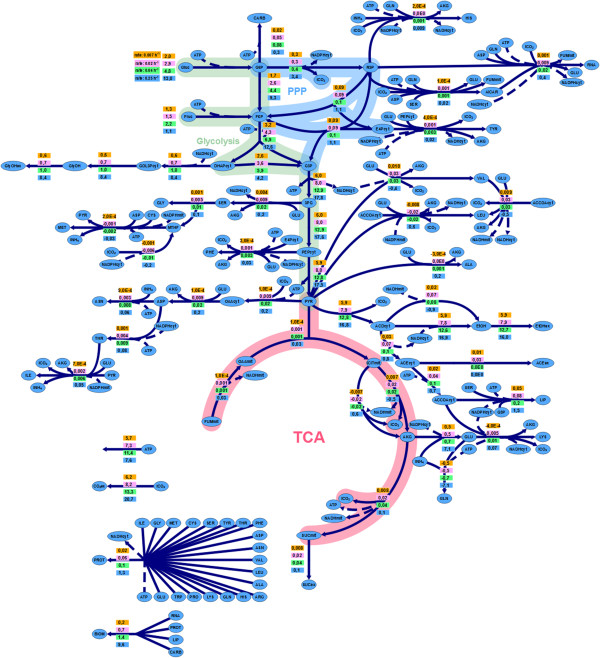
Figure 4.

Metabolic fluxes. Metabolic flux distributions in the EC1118 strain during growth in chemostat cultures at different dilution rates. The values in the boxes correspond, from top to bottom, to fluxes at D = 0.27, 0.04, 0.02 and 0.007 h−1, respectively. Fluxes are given in mmol/(h · gDCW).
