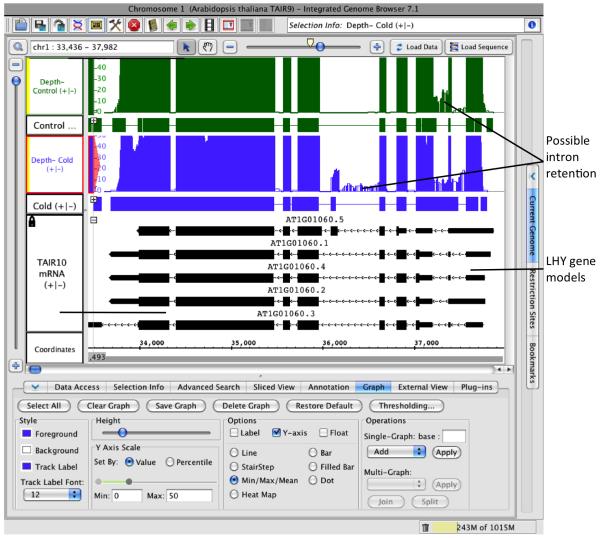
Figure 4. Coverage graphs created from RNA-Seq read tracks.
Coverage graph track derived from read alignment tracks are shown above the read alignment tracks used to create them. To conserve vertical space, read tracks are collapsed. Each graph track has a scale on the left that shows the number of reads overlapping positions indicated in the Coordinates track sequence axis.

