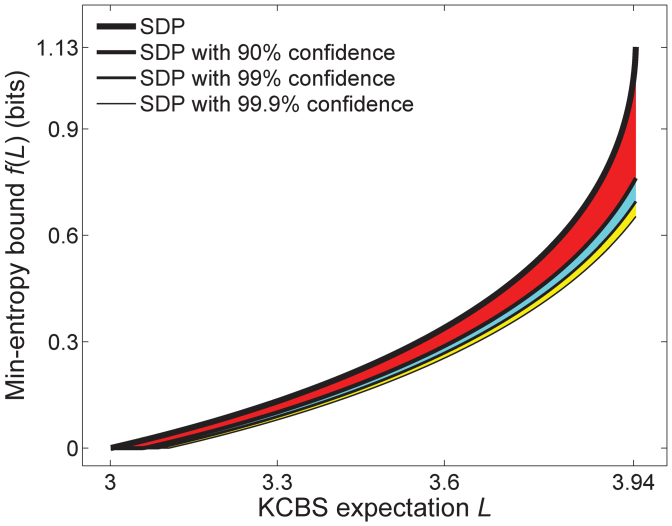
Figure 3. The min-entropy vs. the violation.
The function f(L) in Eq. (8) depending on the violation L of the KCBS inequality (5), which is calculated by semi-definite programming (SDP). The function  at various confidence levels
  such as 90%, 99% and 99.9% are plotted for the uniform choices of measurement configurations, where
  and r = miniP (AiAi+1) = 1/5. Here we divide interval with the spacing
  . Given a measured
  and confidence level, we can estimate the min-entropy of a generated random string as summarized in Eq. (8). Note that we ignore the term log2
δ in Eq. (8) that does not have dependence on the trial n.

