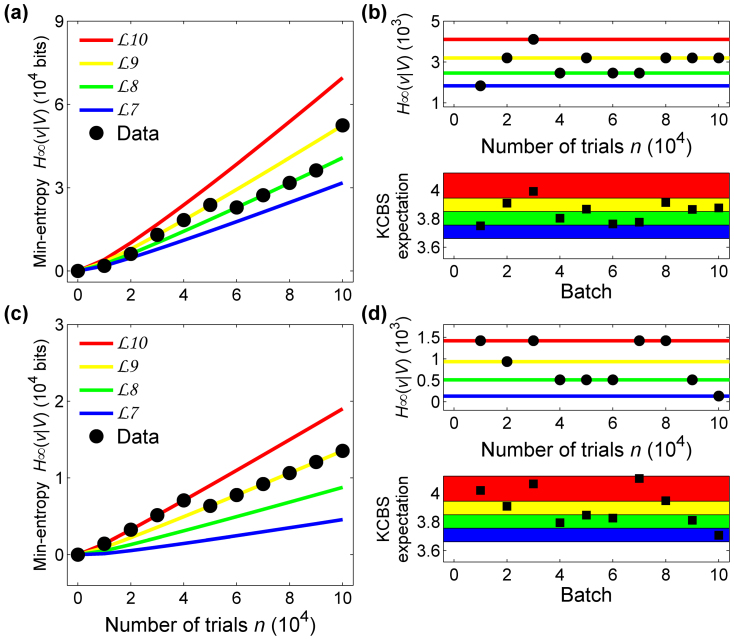
Figure 4. Comparison between theory and experimental results.
(a)(c)The min-entropy H∞ (v|V) (8) depending on the number of trials for (a) an uniform distribution of measurement settings P(Vi) = 1/5 and (c) a biased distribution with P (V1) = 1 − 4q, P (V2) = P (V3) = P (V4) = P (V5) = q, where q = 6(100000)−1/2 with the probablity of errors  and δ = 0.001. The min-entropies H∞ (a|A) (8) are bounded by the relation of the violation
  of the KCBS inequality (8), where we set the 10 intervals of
  between
  and
and  . The min-entropies are linearly increasing as the number of trial increases and the slopes are basically dependent on the thresholds of the intervals
  (blue),
  (green),
  (yellow), and
  (red). The black dots are obtained from the violation values that were observed at the number of trials. (b)(d) The correlation between the KCBS violations (8) and the min-entropy (8) of the strings for (b) the uniform input choices and (d) the baised settings. Here we divide the total 1 × 10⁵ numbers by 10 division and show the KCBS violations
  and min-entropies in the division. We can clearly show that the monitor of
  at each division provides sufficient information to guarantee the min-entropy in the division.

