
Figure 2.
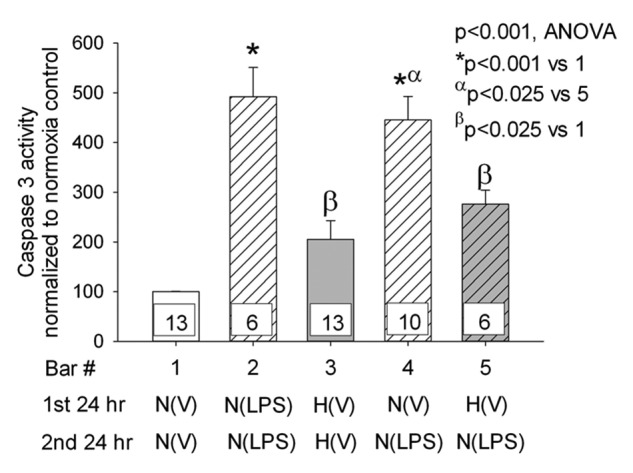
Caspase 3 activity was determined in pulmonary artery endothelial cells (PAECs) incubated in hypoxia or normoxia and treated with vehicle or lipopolysaccharide (LPS). Five groups of PAECs were studied: (1) vehicle for 48 hours in normoxia, (2) LPS for 48 hours in normoxia, (3) vehicle alone for 48 hours in hypoxia, (4) maintenance in normoxia for 24 hours followed by LPS for 24 hours in normoxia, and (5) hypoxia for 24 hours followed by LPS for 24 hours in normoxia. P values for between-group (analysis of variance [ANOVA]) and pairwise multiple comparisons appear in the graph. The number of samples in each group are provided within the bars of the figure. For all figures, the letters below the X-axis indicate the following: N = PAECs incubated in normoxia, H = PAECs incubated in hypoxia, V = cells treated with vehicle, LPS = cells treated with LPS, N(V) = cells incubated in normoxia treated with vehicle, N(LPS) = cells incubated in normoxia treated with LPS, and H(V) = cells incubated in hypoxia treated with vehicle. ANOVA for five groups revealed between-group differences of  . Caspase 3 activity was increased with all treatments compared with untreated normoxia controls and was increased in PAECs kept in normoxia for 24 hours followed by LPS treatment for 24 or 48 hours (*
 , bars 1 vs. 4 and bars 1 vs. 2). LPS also increased caspase 3 activity in cells kept in hypoxic conditions prior to treatment with LPS in normoxia (
 , bars 1 vs. 5). However, the increase was lower than that observed with cells incubated in normoxia prior to treatment with LPS (α
 , bars 4 vs. 5). Caspase 3 activity was assessed in four additional paired samples not shown in this graph. The first was maintained in normoxia for 24 hours, and the second was maintained in hypoxia for 24 hours followed by 10 minutes of reoxygenation for exchange of medium followed by a second 24-hour period of hypoxia. The hypoxia-induced increment in caspase 3 activity in this group of cells (caspase 3 activity was 212% ± 68% of normoxia control) was not different from that of cells maintained in hypoxia for 48 hours without reoxygenation for medium change (
 ). Data in the graph represent data from cells that we maintained for 48 hours in hypoxia without medium exchange or reoxygenation.