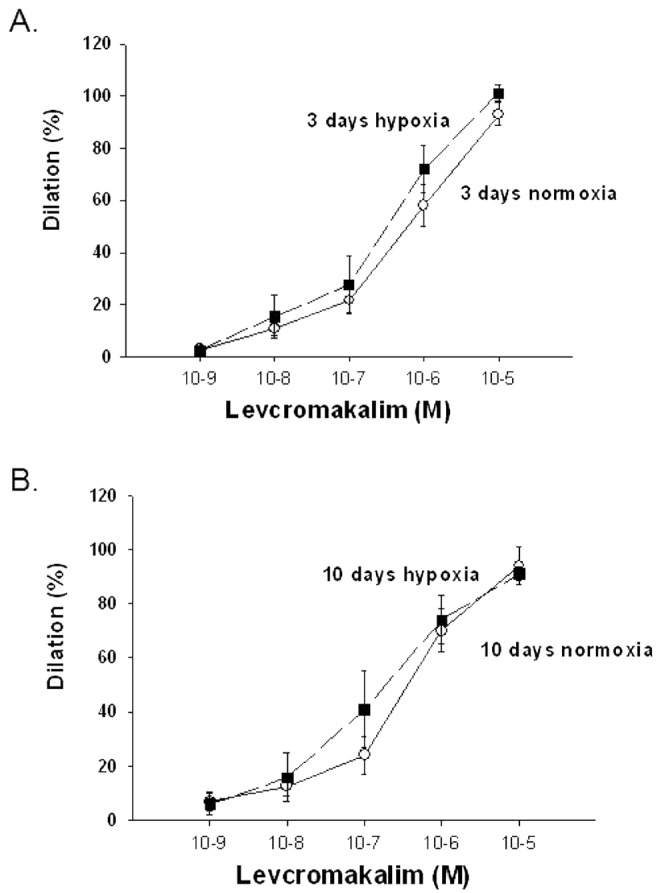
Figure 6.

A, Levcromakalim-induced changes in diameter in arteries with elevated tone from normoxic ( ) and hypoxic (
 ) piglets of the 3-day exposure group. B, Levochromakalin-induced changes in diameter in arteries with elevated tone from normoxic (
 ) and hypoxic (
 ) piglets of the 10-day exposure group. In both panels, all values are mean ± SEM.
