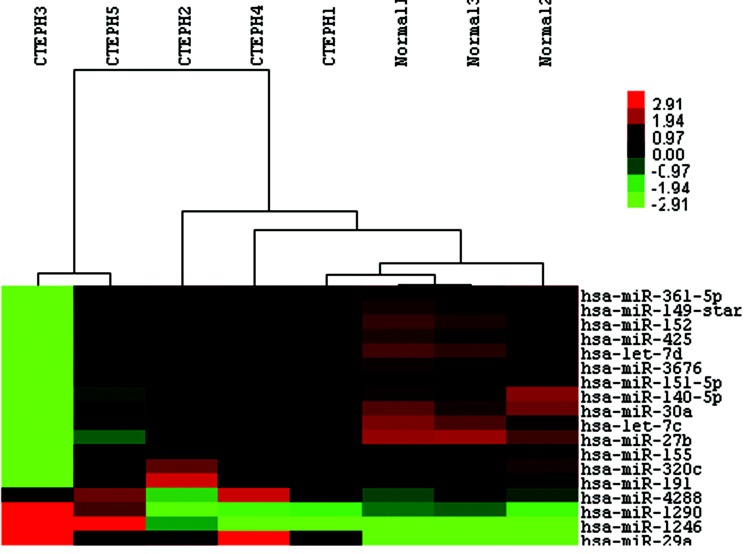
Figure 2.
Heat maps of the 18 microRNAs (miRNAs) expressed differently between 5 chronic thromboembolic pulmonary hypertension (CTEPH) patients and 3 control patients. Rows represent miRNAs, and columns represent patients. A color change from red to green indicates that expression was downregulated. In contrast, a color change from green to red indicates that expression was upregulated. Color brightness represents the signal values of miRNAs in the microarray chip.

