
Figure 1.
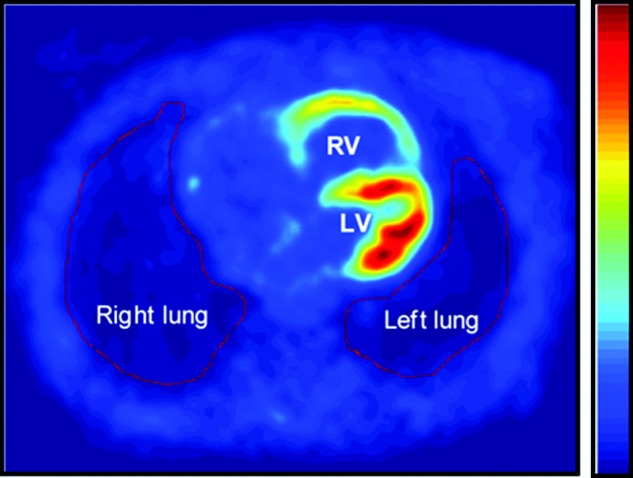
Typical example of a transaxial 2-deoxy-2-[18F]-fluoro-d-glucose (18FDG) positron emission tomography image from an idiopathic pulmonary arterial hypertension (IPAH) patient, acquired 55–60 minutes after 18FDG administration. The color scale represents 18FDG uptake, ranging from dark blue (lowest uptake) to dark red (highest uptake). LV: left ventricle; RV: right ventricle. Red lines indicate total lung regions of interest.