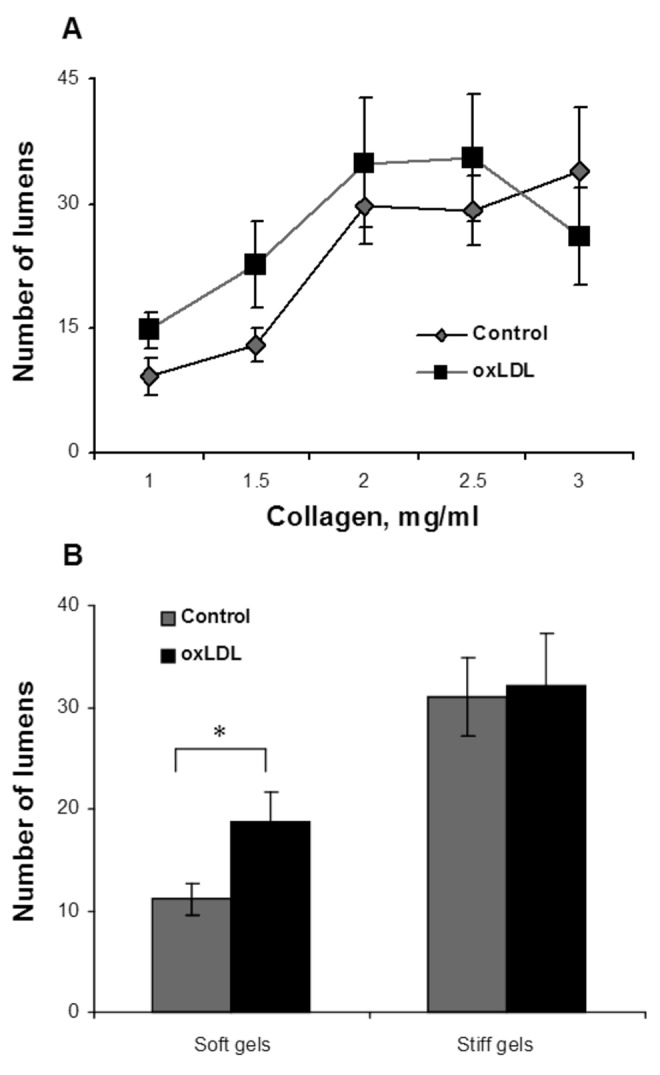
Figure 4.

Analysis of lumen quantity as a function of gel collagen concentration and oxidized low-density lipoprotein (oxLDL). A, Average number of lumens formed per gel by oxLDL-treated cells (black squares) and control cells (gray diamonds) as a function of collagen concentration, demonstrating an increase in the number of lumens with the increase in gel collagen concentration. B, Pooled data for lumen number in soft (1.0- and 1.5-mg/mL collagen concentration) and stiff (2.0–3.0-mg/mL collagen concentration) gels, demonstrating a significant increase in the number of lumens in stiff gels versus soft gels, as well as a significant increase in oxLDL-treated cells observed in soft gels but not stiff gels. The data show mean ± standard error of the mean ( ).
).
