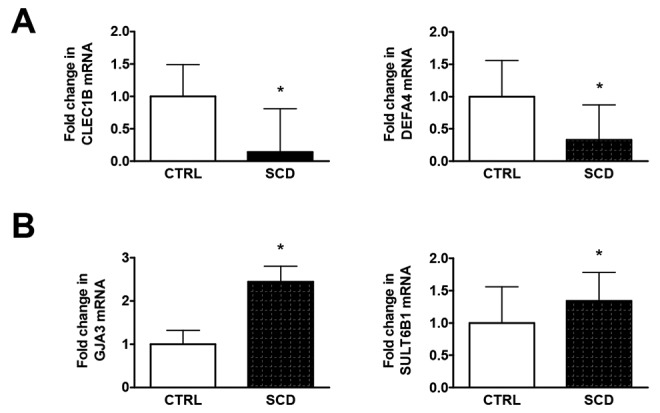
Figure 6.

Reverse-transcription polymerase chain reaction validation of microarray data of changes in RNA expression in sickle cell disease (SCD) lung tissue of selected genes. Data represent the mean ± standard deviation of 5 technical replicates of the SCD lung tissue and 5 technical replicates each of 4 normal control lung tissue specimens. Asterisks indicate a statistically significant difference (P < 0.01) compared with control (CTRL).
