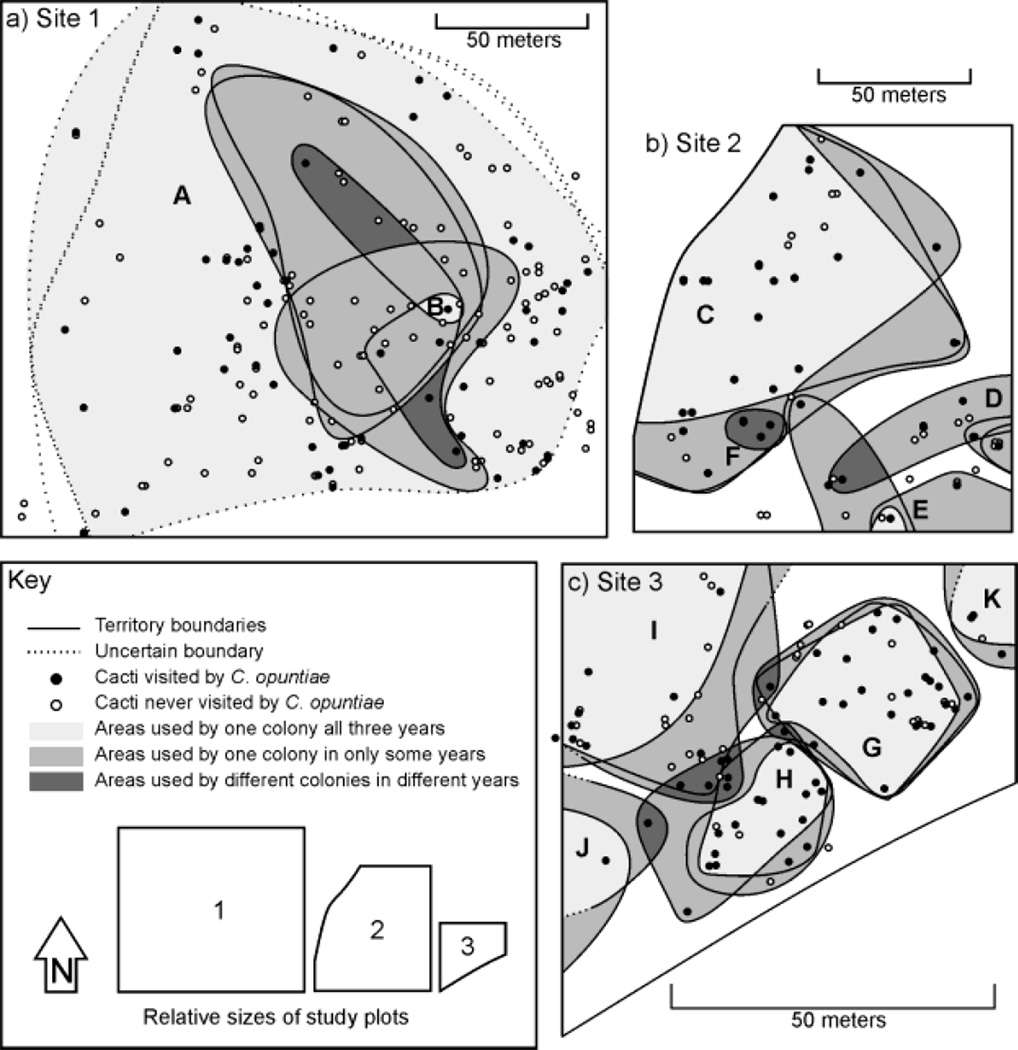
Fig. 1.
Maps showing the 2007, 2008, and 2009 territory boundaries that we deduced using the behavioral assay method for C. opuntiae colonies on a) Site 1, b) Site 2, and c) Site 3. Areas used by a single colony during all three years are shown in light gray, while areas that were sometimes used by one colony are highlighted in medium gray. Areas that changed colony ownership over the course of the study are shown in dark gray. C. opuntiae were never observed on cacti in white areas.

