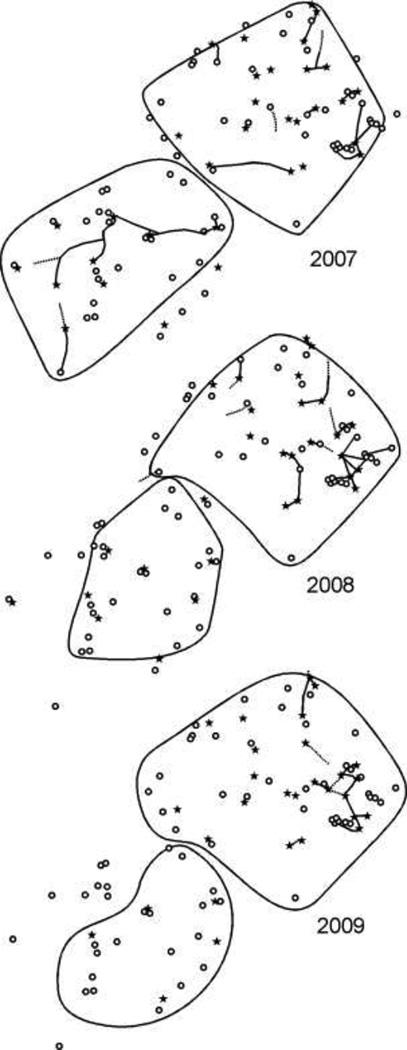
Fig. 3.
Maps showing the trails and nests found for Colony G at Site 3 in August 2007, August 2008, and August 2009. Cacti are indicated as open circles, and nest entrances are represented by black stars. Trails with heavy traffic (10–30 ants per minute) are shown as solid lines, while trails with lighter traffic (<10 ants per minute) are shown as dotted lines. Some trails appear to dead-end on this map where they entered areas of vegetation that were impassible to researchers.

