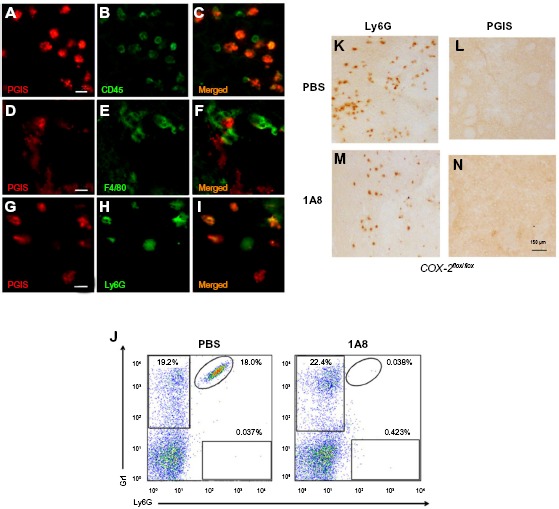
Figure 3.

Identification of PGIS expressing cell types in the lesion core.
Notes: PGIS-labeled cells (A, D and G) double labeled with CD45 (B), F4/80 (E), and Ly6G (H). Merged pictographs for PGIS/CD45 (C), PGIS/F4/80 (F), and PGIS/Ly6G (I) double-positive cells. Scale bars: 25 μm (A–I). Representative flow cytometric dot plots of Ly6G-positive/Gr1-positive blood neutrophils (J) from TZG-injected mice following in vivo administration of either neutrophil depleting antibody 1A8 or PBS. Ly6G (K and L) and PGIS (M and N) expressing cells in brains of TZG treated mice following PBS (K and M) or 1A8 (L and N) treatment. All IHC and flow cytometric assessments were made 12 hours following TZG injections. Scale bars: 150 μm.
Abbreviations: IHC, immunohistochemistry; PBS, phosphate buffered saline; PGIS, prostacyclin synthase; TZG, (RS)-(tetrazol-5-yl)glycine.
