
Figure 4.
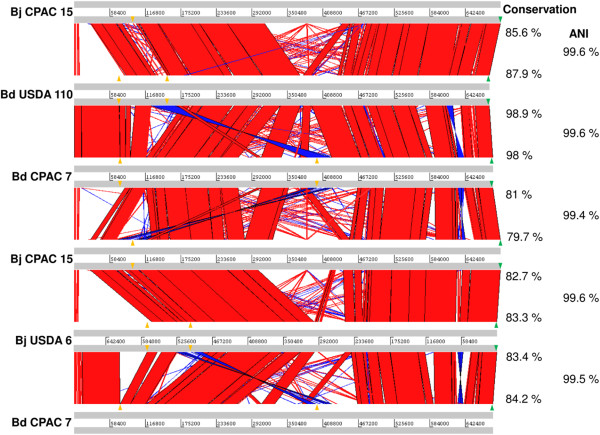
Multiple comparison of the symbiosis islands of B. diazoefficiens strains USDA 110 T and CPAC 7, and B. japonicum strains USDA 6 T and CPAC 15. Percentages of island conservation between strains are indicated at right, as well as the average nucleotide identity (ANI) values of the conserved regions. Green triangles indicate the initial tRNA-Val gene while orange triangles indicate other t-RNA genes located inside the islands.