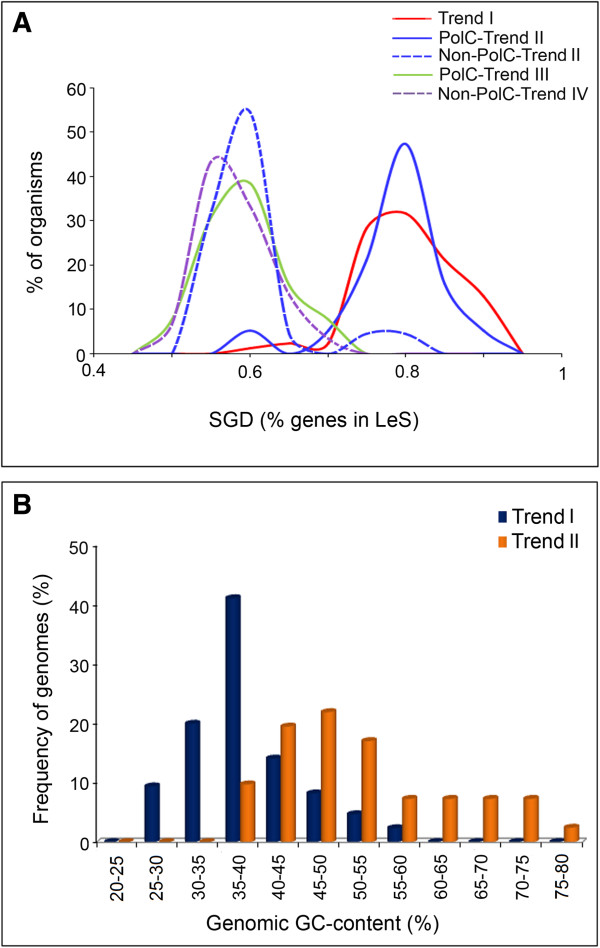
Figure 6.

SGD and Genomic GC-content distribution profiles in organisms showing different trends. (A) Distribution of SGD in Trend I (red solid line), PolC-Trend II (blue solid line), non-PolC-Trend II (blue dotted line), PolC-Trend III (green solid line) and non-PolC Trend IV (violet dotted line) organisms; (B) Distribution of Genomic GC-content for Trend I and Trend II organisms.
