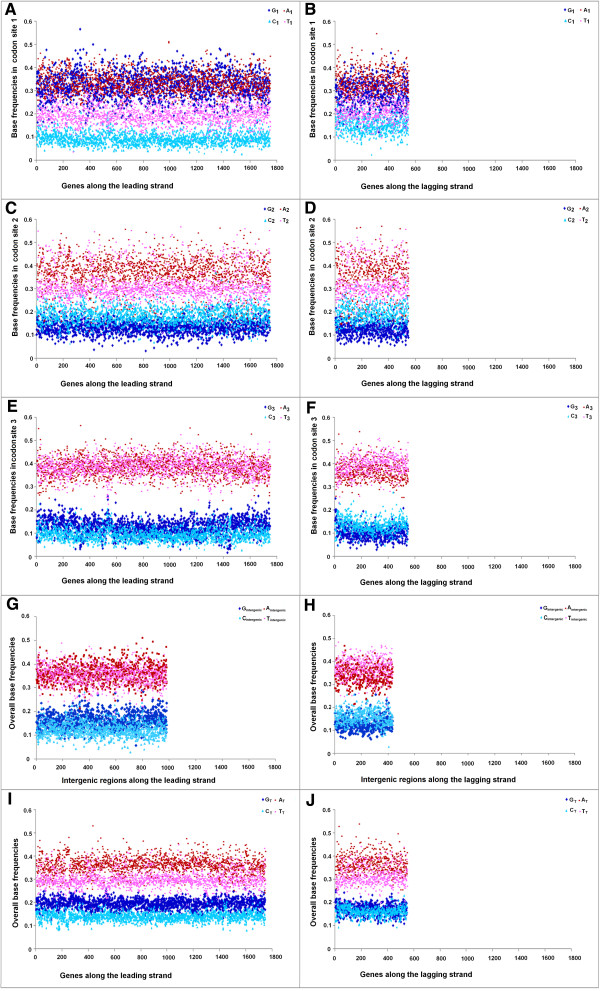
Figure 7.

Trends in individual base usages in Staphylococcus aureus 04–02981 for genes encoded by both LeS and LaS. Subscripts 1, 2, 3 indicate the percentage of occurrences of the respective base at 1st ( A , B ), 2nd ( C , D ) and 3rd ( E , F ) codon sites, intergenic indicate the percentage of intergenic regions ( G , H ) and the subscript T stands for the total percentage ( I , J ) of occurrence of the base in individual genes of the organism.
