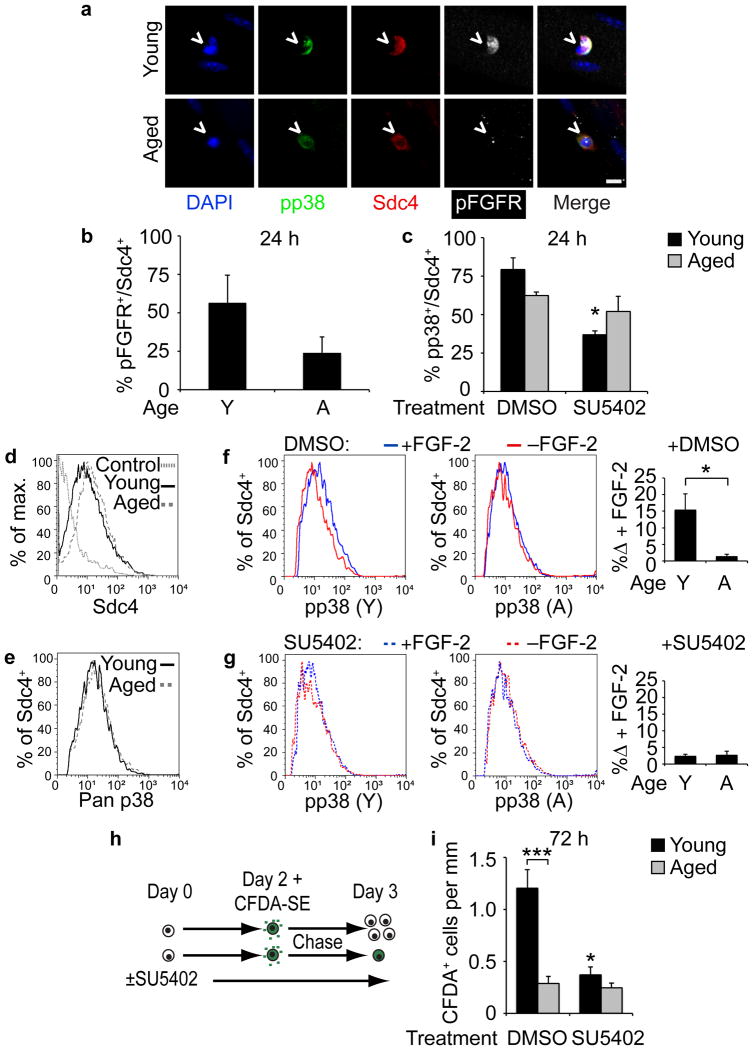
Figure 4. FGFR1 signaling is altered in aged compared to young SCs.
(a–c) (a) Young and aged Sdc4+ myofiber-associated SCs (^) cultured for 24 h and immunostained for pp38 and phospho-FGFR (pFGFR). Scale bar, 10 μm. (b) Percentage of pFGFR+ SCs out of total Sdc4+ SCs (Mean ± s.e.m., n = 3 experiments, ≥ 20 myofibers scored/condition). (c) Percentage of phospho-p38+ SCs of total Sdc4+ SCs after 24 h treatment with DMSO or SU5402 (*P < 0.05 for Young DMSO vs. SU5402, two-way ANOVA. n = 3 experiments, ≥ 20 myofibers scored/condition). (d–g) Flow cytometric analysis of young and aged pp38+ SCs with or without FGF-2 addition. Histograms of (d) percent of Sdc4+ events of total (max.) events and (e) p38αβ MAPK+ events of Sdc4+ subsets. Histograms of pp38+ SCs (gated on Sdc4+) following a 5 min FGF addition to (f) SCs in DMSO or (g) 25 μM SU5402 quantified (right) for FGF-2-induced increases in pp38+ (n = 3 experiments. *P < 0.05, t test). (h–i) (h) CFDA-SE retention assay identifies self-renewed (Pax7+/CFDA-SE+), myofiber-associated SCs. (i) Average number of Pax7+/CFDA-SE+ SCs per myofiber length after a 72 h treatment with DMSO or SU5402 (*P < 0.05 for Young DMSO vs. SU5402; ***P< 0.001 for Young vs. Aged DMSO, two-way ANOVA). Mean ± s.e.m. for all.

