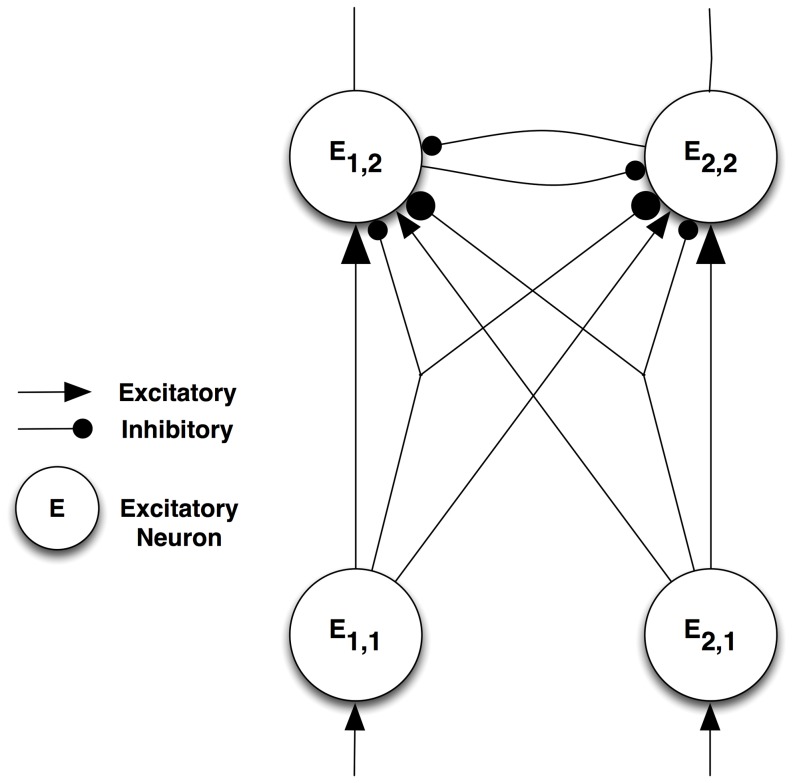
Figure 3. The network structure.
Input neurons are at the bottom. Similar to the Reynolds and Desimone model [11], we include both excitatory and inhibitory inputs in all combinations. Excitatory and inhibitory connections are represented by arrows and circles, respectively. Connection size correlates with connection weight, i.e. E1,2 receives large inputs from E1,1 (excitatory) and E2,1 (inhibitory), and small inputs from E1,1 (inhibitory) and E2,1 (excitatory).

